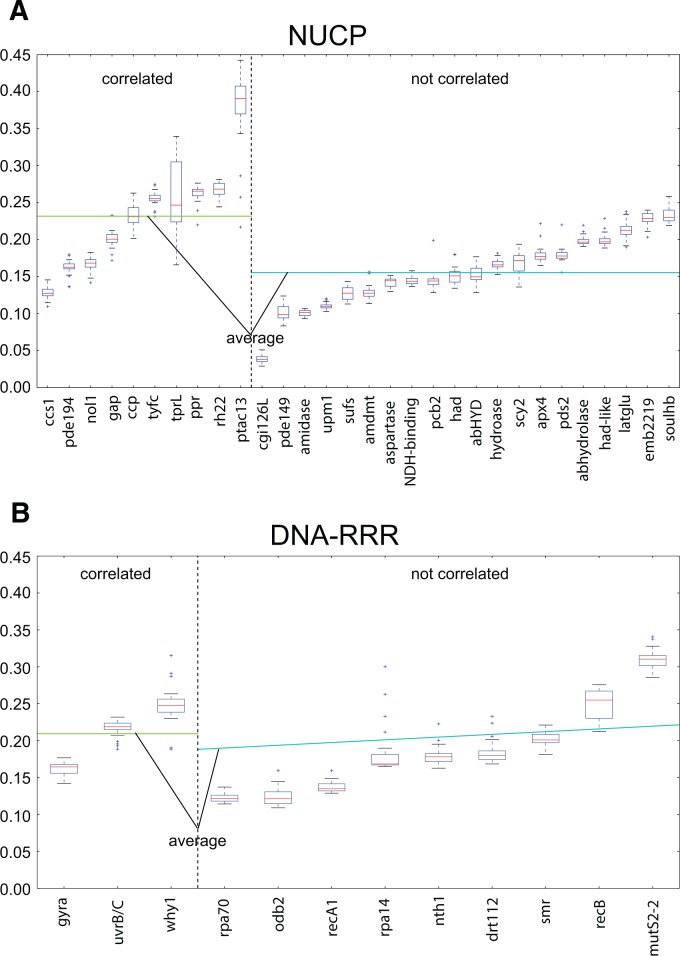
Fig. 4.—
Comparison of dN of genes with and without significant correlation to genome complexity. dN of genes from (A) NUCP or (B) RRR gene groups were compared. NUCP, nuclear encoded plastid targeted control genes; RRR, plastid-targeted DNA replication, recombination and repair genes. Boxes represent sorted rates ranging from 25% to 75%, dashed lines extend to maximal and minimal rates, red lines represent the median rate for each gene group, and outliers are shown as “+.” Horizontal lines represent average rate of gene groups with correlation (green) or without correlation (cyan).

