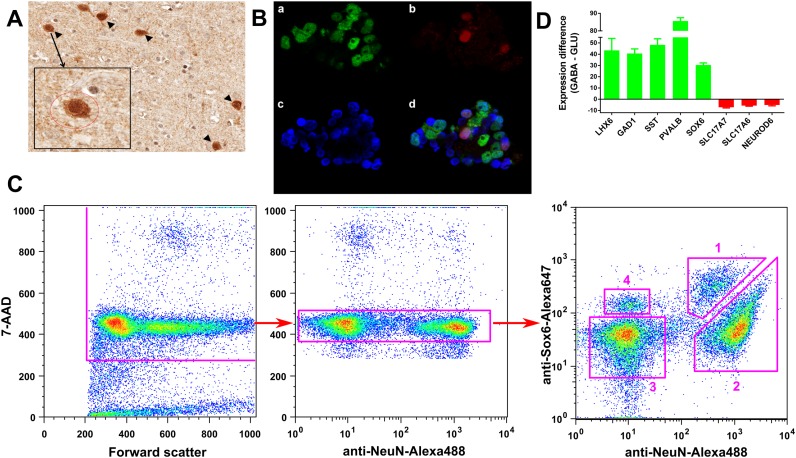
Figure 1.
Isolation of GABAergic (GABA) and glutamatergic (GLU) neuronal nuclei from the human PFC. (A) Immunohistochemical co-localization of PVALB positive (+) (brown) and SOX6(+) (dark grey) PFC cells. The majority of PVALB(+) cells are also SOX6(+) (arrow heads). Small round grey nucleus profile in the Insert is probably an oligodendrocyte. (B) Validation of anti-SOX6 antibodies by immunofluorescence confocal imaging of the PFC nuclei. The image is a representative example from several experiments. Nuclei were stained with anti-NeuN antibodies (a, green color), which label all neuronal nuclei, anti-SOX6 antibodies (b, red color), which label a subpopulation of GABA neuronal nuclei, and DNA stain DAPI (c, blue color). Panel (d) depicts the overlap of images (a–c). (C) Isolation of the PFC neuronal nuclei subpopulations by FACS. Figure shows sequential gating steps using anti-NeuN and anti-Sox6 antibodies, and 7-AAD DNA stain. Left: exclusion of debris and nuclear fragments. Middle: exclusion of doublets of nuclei and nuclei of dividing cells. Right: separation of neuronal and non-neuronal nuclei based on NeuN labelling intensity, and separation of SOX6(+) and SOX6(-) signals: (1) SOX6(+)NeuN(+)—GABA neurons; (2) SOX6(-)NeuN(+)—GLU neurons; (3) SOX6(-)NeuN(−)—GLIA; (4) SOX6(+)NeuN(−)—SOX6(+) GLIA. (D) Confirmation of enrichment of SOX6(+)NeuN(+) and SOX6(−)NeuN(+) fractions for known markers of GABA (green bars) and GLU (red bars) neurons, respectively. Shown are fold-differences that represent GABA to GLU (positive values) or GLU to GABA (negative values) gene expression ratios. The data were obtained using qPCR.

