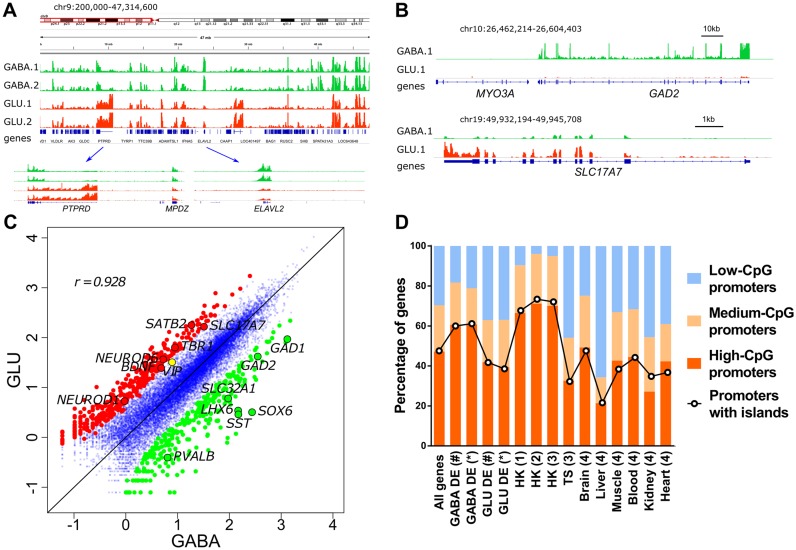
Figure 2.
Cell-specific intranuclear transcriptomes of GABA and GLU neurons obtained by RNA-seq. (A) Integrative Genomics Viewer (IGV) (96) snapshot of intranuclear transcriptomes derived from GABA and GLU neuronal nuclei obtained from the OFC of 2 individuals. Tracks are colored by cell type; GABA neurons are shown in green, and GLU neurons in red; 1 and 2 denote individual subjects. Two regions that represent genes with predominant expression in GLU (PTPRD) or in GABA (ELAVL2) neurons are shown in the lower panel. (B) Profiles for archetypical GABA-specific (GAD2, encodes GABA-synthesizing enzyme glutamate decarboxylase 2; upper panel) and GLU-specific (SLC17A7, encodes vesicular glutamate transporter, VGLUT1; lower panel) genes. Note that MYO3A (neighboring GAD2), which is specifically expressed in cochlea and retina, does not show any significant number of reads mapped to its locus. (C) Pairwise comparisons of gene expression measured by RNA-seq in GABA and GLU neurons. The most differentially expressed genes (>5-fold change) are shown as colored circles, and selected neuron subtype-specific genes are labelled. r, Spearman correlation of log10-transformed RNA-seq read counts. (D) Percentage of GABA-DE and GLU-DE genes with low-, medium- or high-CpG content within promoter regions, and with promoters that overlap CpG islands. GABA-DE and GLU-DE genes were defined using criteria of (#) >2-fold enrichment and FDR < 0.05 or (*) >4-fold enrichment and FDR < 0.01. All genes, data for all RefSeq genes; (1) housekeeping (HK) genes identified in (63,64); (2) HK genes identified in (62); (3) HK genes identified in (61); TS, all tissue specific genes identified in (61); (4) TS genes identified in individual tissues in (65). Promoter regions were defined as regions proximal to TSS (−1000 bp to +100 bp). Assignment of promoters to low, medium or high-CpG groups is shown in Supplementary Figure S4.

