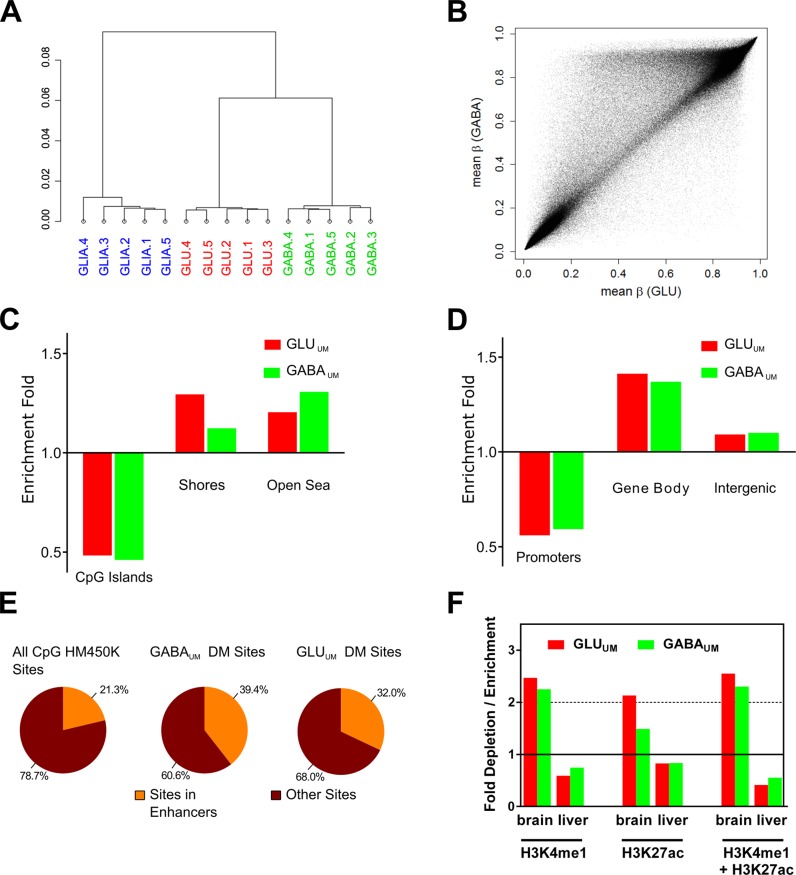
Figure 3.
Characterization of DNA methylation in GABA and GLU neurons and in GLIA by Infinium HM450K array. (A) Unsupervised hierarchical clustering of CpG methylation data. 1, 2, 3, 4, 5 denote individual subjects. (B) Scatter plot comparing averaged (across all five subjects) CpG methylation between GABA and GLU samples. Each point represents an averaged β value for one CpG site from the array. The data demonstrate significant differences in total CpG methylation among neuronal subtypes. (C) Enrichment / depletion of the differentially methylated (DM) CpG sites in CpG islands and shores. ‘Open sea regions’ denote areas outside CpG islands and shores. (D) Enrichment / depletion of the DM CpG sites within promoters, gene bodies and intergenic regions. (E) Enrichment of the DM CpG sites within predicted enhancers defined according to HM450K array annotation. (F) Enrichment of the distal CpG DM sites within predicted enhancers defined based on ChIP-seq data from REMC for human brain (combined data sets for medial prefrontal cortex and hippocampus), liver, muscle and heart (74). Tissue-specific histone marks were defined as mark-enriched regions which are only present in one specific tissue but not in three other tissues.

