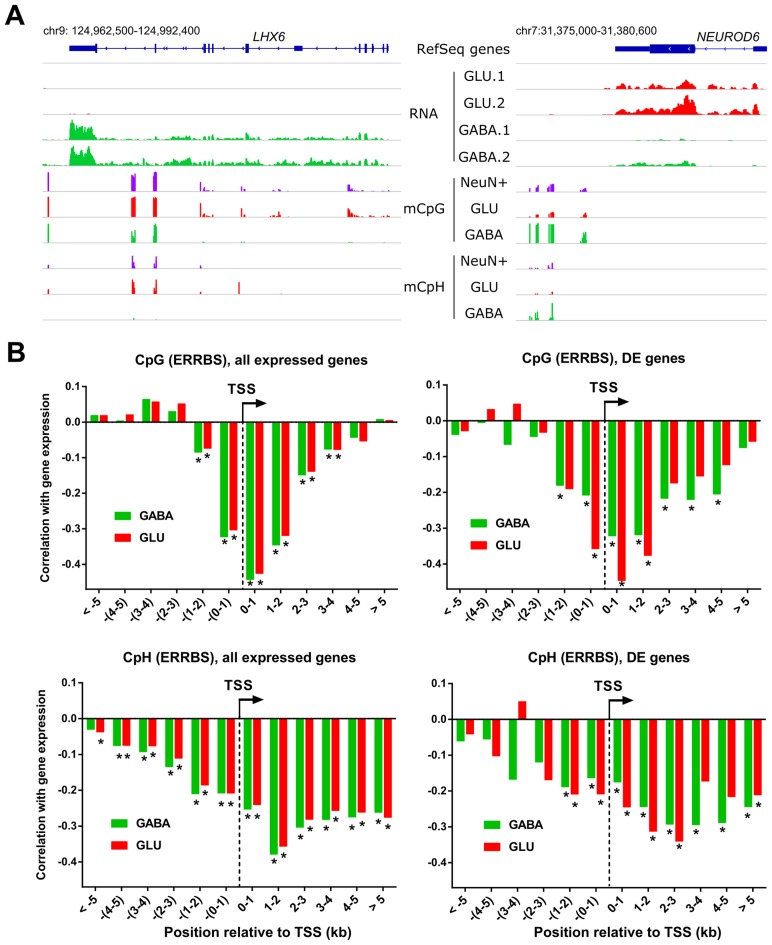
Figure 5.
Analysis of correlation between DNA methylation and gene expression. (A) RNA-seq read density and DNA methylation in CpG and non-CG contexts from ERRBS assay (CpG and CpH) at two genes, LHX6 and NEUROD6 that are specific for MGE-derived GABA and GLU neurons, respectively. Traces for GLU and GABA neurons are marked in green and red, respectively. NeuN(+) CpG and NeuN(+) CpH are mixed neuron ERRBS data from (37). 1 and 2 denote RNA-seq data for two different subjects. (B) Spearman correlations between mCpG or mCpH and RNA expression levels of all expressed genes (left panels) and differentially expressed genes (right panels). For each gene, mCpG or mCpH sites were combined into 1kb bins as a function of the distance from TSS. The significance (*) was determined as P < 0.01 after Bonferroni correction for the number of bins (N = 12).

