Figure 6.
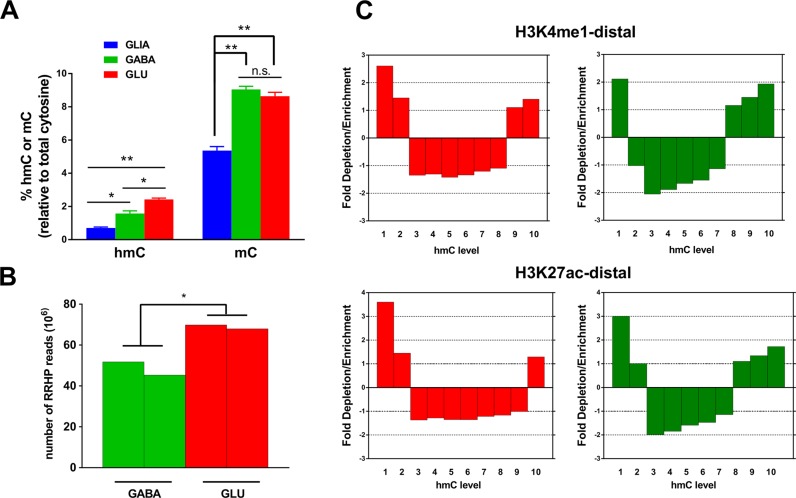
Analysis of hydroxymethylation in GABA and GLU neurons. (A) Percentage of total cytosine residues containing hmC or mC modifications in human cortical non-neuronal cells (GLIA), GABA neurons or GLU neurons, as measured by the mass-spectrometry-based methodology (N = 4 samples for each cell type). *P <0.01, **P <0.0001 (ANOVA followed by Tukey's post hoc test). (B) Levels of hmC in GABA and GLU neurons measured by the RRHP method in two replicate samples. Total number of reads is the measure of hmC content; *P <0.01 (by t-test). (C) Enrichment or depletion of hmC within predicted distal enhancers. All CCGG regions for which the hmC data were obtained by the RRHP method were subdivided into 10 equally populated groups (from lowest to highest levels of hmC). Predicted enhancer positions were obtained from the REMC ChIP-seq data for distal H3K4me1 and H3K27ac histone marks (74). GLU neurons—red color, GABA neurons-green color.

