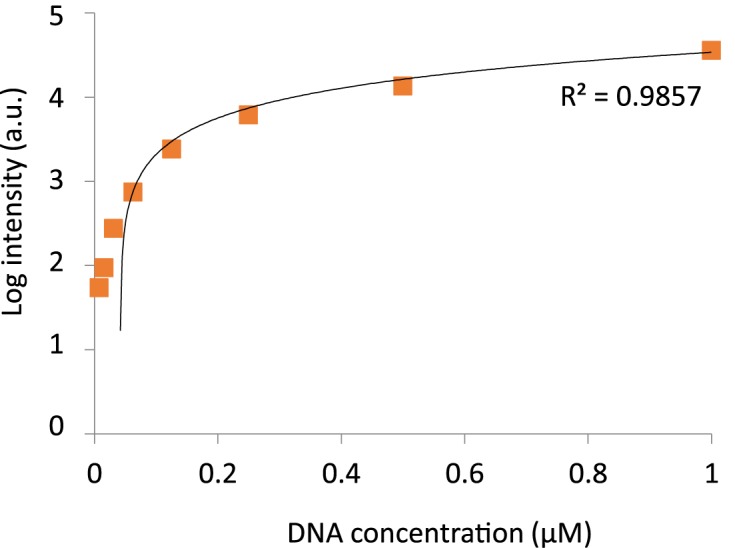
Figure 2.

Calibration curve for on-chip DNA concentrations. Cy5 labeled oligonucleotides at concentrations ranging between 0.005–1 μM were introduced into the device. Cy5 intensity was measured and a calibration curve (y = 35579x - 1471) was plotted (n = 128).
