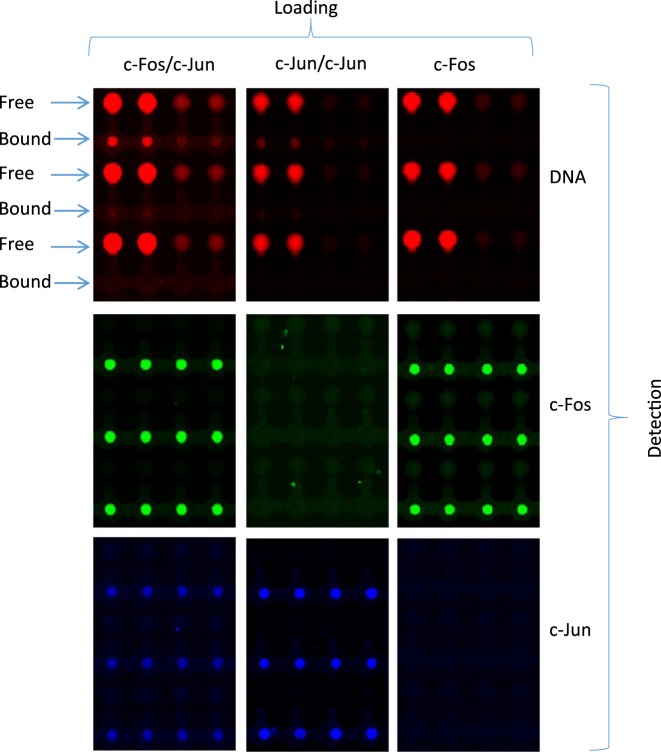
Figure 4.
Fluorescent image of protein–DNA interaction (upper), c-Fos expression (middle) and c-Jun expression (lower). Each row is a different DNA sequence at 4 different concentrations. Each column is a different TF. c-Jun/c-Fos heterodimers (AP-1 complex) (left) interacted with DNA in high affinity, while c-Jun/c-Jun homodimers (middle) interacted in low affinity and c-Fos monomer (right) did not interact with DNA.

