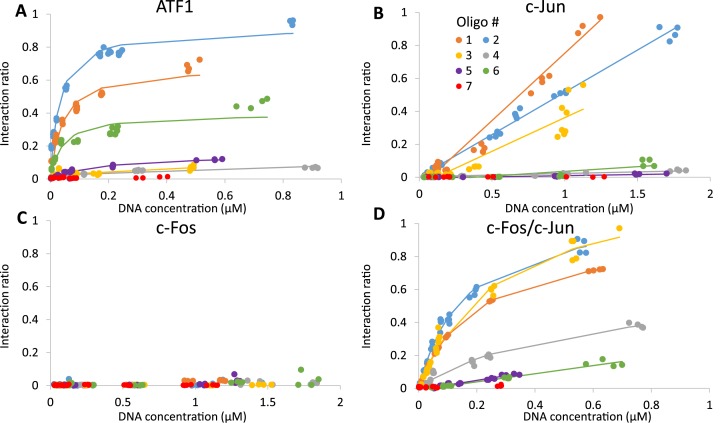
Figure 6.
Quantitative analysis Kd's. Affinity measurements between ATF1 (A), c-Jun (B), c-Fos (C), AP-1 (D) and CRE sequences. We programmed the QPID device with different CRE consensus sequences. Each TF was immobilized to the device surface, flooding DNA chambers solubilized spotted DNA, allowing TF and DNA to interact. Protein expression levels (Cy3) and interacting DNA signals (Cy5) were measured. Interaction ratio – Cy5\Cy3 (colors refer to oligonucleotide number in Figure 3).

