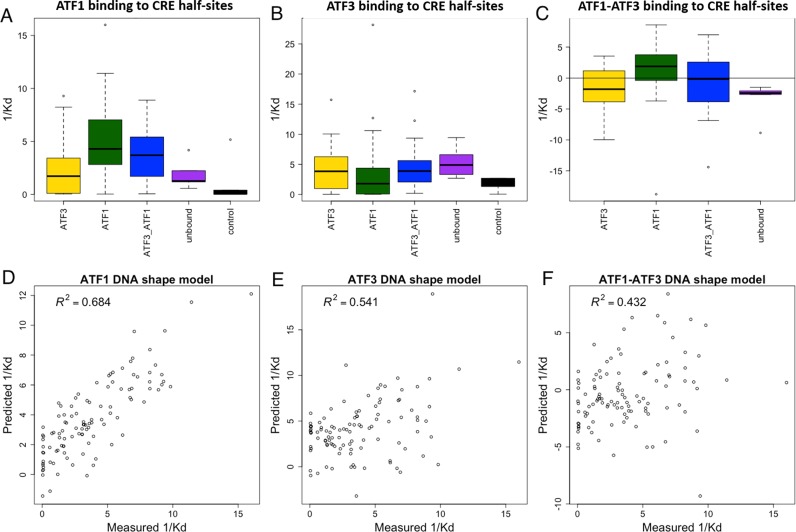
Figure 9.
QPID measurements explain in vivo binding differences between ATF1 and ATF3 to CRE half-sites. (A and B) Boxplots of affinity constants (1/Kd) in different binding site categories. ATF1 and ATF3 have higher affinities to sites they bound uniquely than sites bound by the other protein, unbound and controls. (C) Boxplots of affinity constant (1/Kd) differences between ATF1 and ATF3 in different binding sites categories. ATF1 has higher affinity in sites it binds uniquely than in sites bound by ATF3. (D and E) Fit of DNA shape features- based model to measured affinities. For each protein, multiple linear regression was used to infer a binding model based on DNA shape features. (F) Fit of DNA shape features-based model to difference in measured affinities. Multiple linear regression was used to infer a model for the difference in binding affinities.

