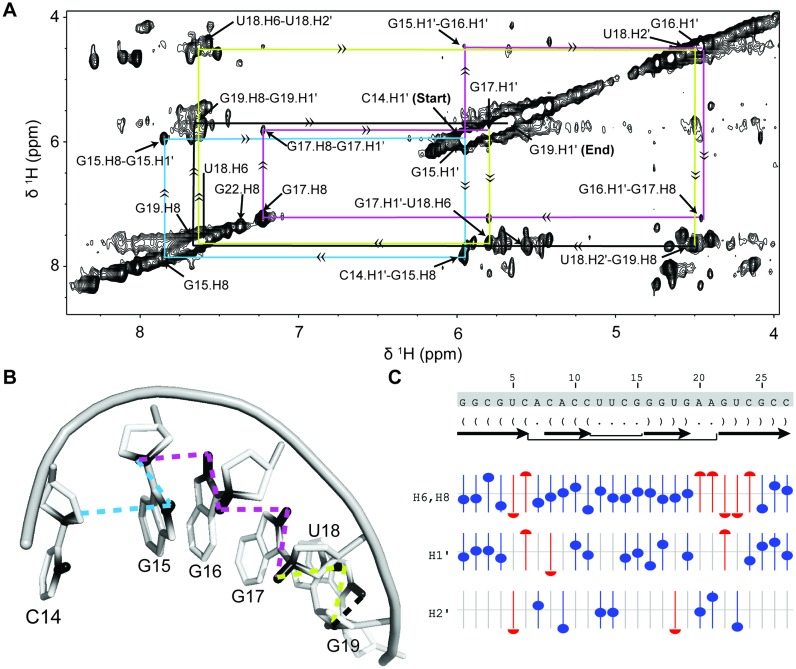
Figure 5.
(A) NOESY walk of the bacterial A-site RNA using alternatively labeled nucleotides. Starting at the H1′ of C14, the connectivity from the sugar H1′/H2′ to C8/C6 of the N+1 base enables sequential assignment all the way to the H1′ of G19. This allowed the consecutive assignment of 6 residues present in the helical environment. Connectivities follow the placed arrows and move sequentially from cyan to magenta to yellow to black. (B) Pymol representation of the NOESY walk using the same coloring scheme as used in the NOESY walk (PDB: 1A3M (98)). (C) Predicted versus actual chemical shift values for the assigned residues as determined by NMRViewJ (One Moon Scientific). The offset from the central line represents how far the assigned resonance is from its predicted value. Blue circles represent resonances that are less than 0.1 ppm from predicted values, red circles have predicted ppm more than 0.1 ppm away from observed chemical shift.

