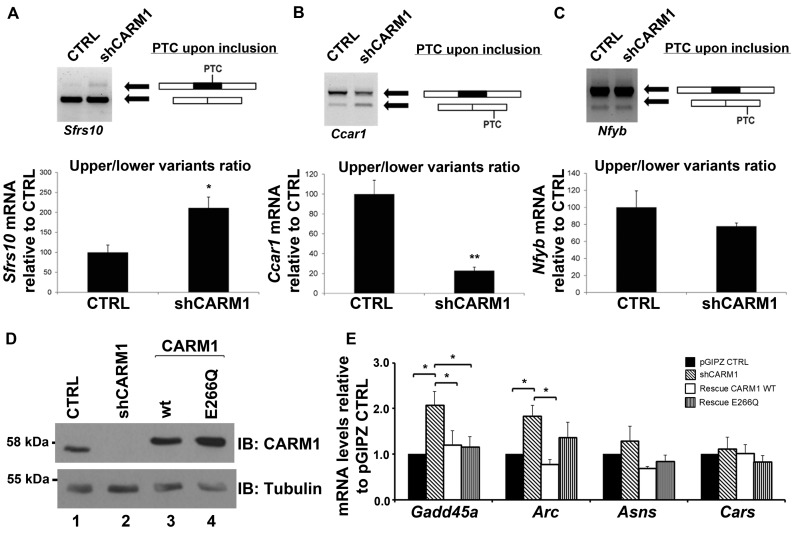
Figure 5.
CARM1 regulates a diverse subset of known NMD targets. (A) Total RNA was extracted from MN-1 pGIPZ CTRL and MN-1 shCARM1 cell lines. PCR primer sets were designed to flank the PTC resulting either by exon skipping or exon inclusion. For Sfrs10, PTC occurs upon exon inclusion. Values shown in the bar graph are means +/− SEM, n = 4. (B) For Ccar1, PTC is generated upon exon skipping. Values shown in the bar graph are means +/− SEM. (C) In the case of Nfyb gene, PTC is generated upon exon skipping. After optical quantification of the upper/lower splicing variants ratio, results are expressed relative to the MN-1 pGIPZ CTRL cell line. Values shown in the bar graph are means +/− SEM, n = 3 (D) A rescue was performed in two of the MN-1 shCARM1 cell lines by then transfecting with either the WT-CARM1 or the CARM1-E266Q mutant expression vectors for an additional 24 h. Protein lysate from transfected MN-1 lines confirm the knockdown and overexpression of CARM1 or the E266Q mutant, normalized to Tubulin. (E) Total RNA was extracted and RT-qPCR was used to measure the mRNA levels of targets which were normalized to 18s RNA levels and presented as relative to pGIPZ CTRL target mRNA levels. Data are means +/− SEM (n = 3).

