Figure 4.
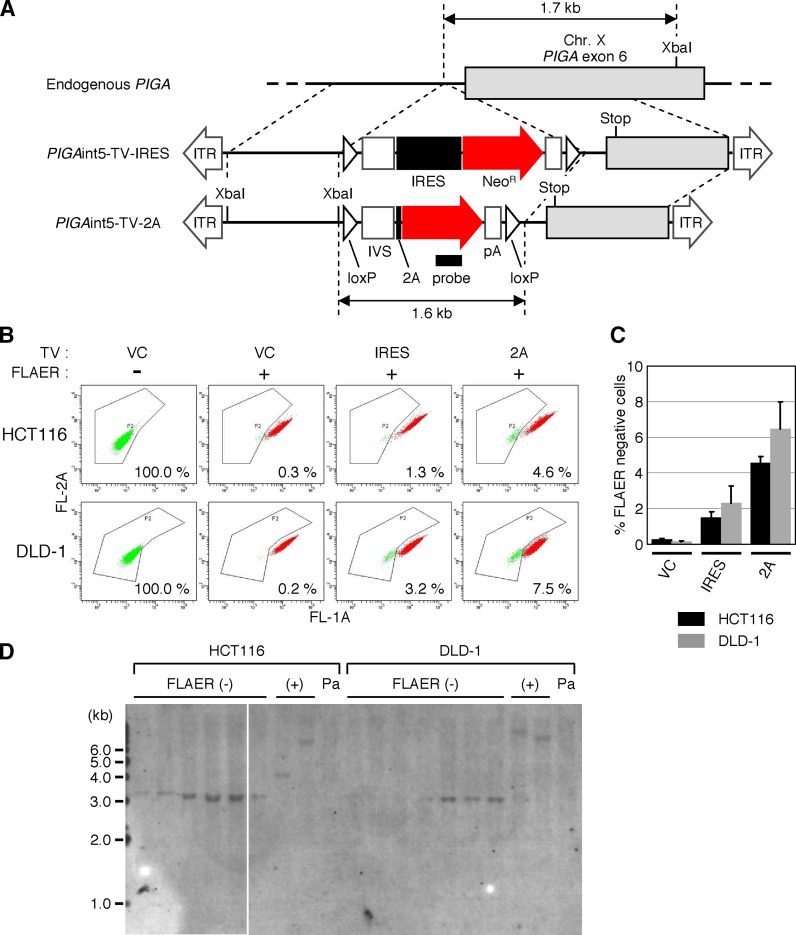
H/R ratios of AAV-based targeting vectors assessed by targeting of a PIGA intron. (A) A scheme describing the targeting of PIGA intron 5. A filled small rectangle indicates the location of a probe used in Southern blot analysis shown in (D). XbaI: restriction enzyme XbaI site. For other abbreviations, see legends for Figures 1–3. (B and C) H/R ratios of targeting vectors disrupting PIGA intron 5. The HCT116 and DLD-1 cell lines were infected with the AAV-based targeting vectors PIGAint5-TV-IRES (IRES), PIGAint5-TV-2A (2A) or an AAV vector targeting an unrelated gene created based on pAAV-2Aneo (VC). Infected cells were selected with G418, stained with FLAER and then analyzed by FCM. Cells infected with VC but not stained with FLAER were included as further controls. Shown are representative dot plots with the ratio of FLAER-negative cells noted in the respective plots (B) and a graphic representation of data obtained with cells subjected to FLAER-staining (mean ± s.e.m.; n = 3) (C). (D) Southern blot analysis of FLAER-negative and -positive single-cell clones. FLAER-negative and -positive cells were sorted from the HCT116 and DLD-1 cell lines infected with PIGAint5-TV-2A and subjected to single cell cloning. Genomic DNA was isolated from the resulting clones, digested with XbaI and processed for Southern blot analysis with a probe depicted in (A). A white line within the gel image indicates the border of two distinct gels. Pa: parental cell line.

