Figure 4.
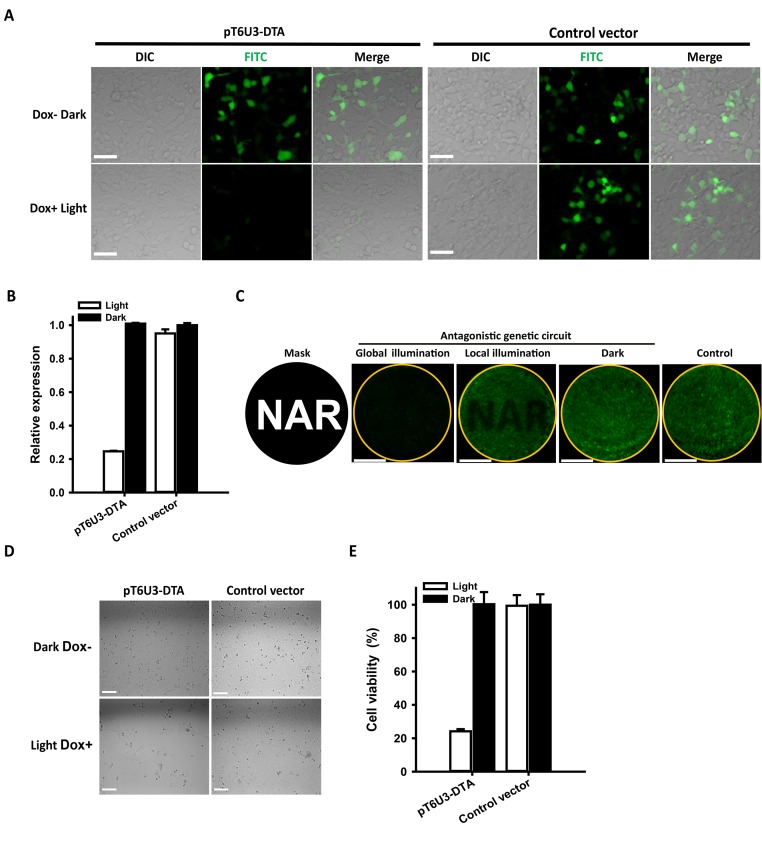
Stringent control of toxin DTA expression by the antagonistic dual-input genetic circuit. (A) Fluorescence imaging of hrGFP expression. HEK293 cells were co-transfected with pT6U3-DTA, pGAVPO, pTetR-KRAB and pCDNA3.1-hrGFP, and cultured in the darkness without Dox, or upon blue light exposure with Dox. An empty plasmid pT6U3 was used to replace pT6U3-DTA as the negative control. Imaging of hrGFP was conducted 48 h after transfection by fluorescence microscopy using the FITC channel. Scale bar, 50 μm. (B) Quantitative analysis of hrGFP expression. The transfected cells after imaging were digested with trypsin-EDTA and washed with phosphate-buffered saline (PBS). Fluorescence was determined using a Microplate Reader (BioTek) with 485/20 excitation filter and a 528/20 emission filter. The data were normalized to the cells transfected with control vector and kept in darkness without Dox. The data are shown as the mean ± SD (n = 3). (C) Spatial control of DTA expression for local inhibition of hrGFP expression. The engineered cells, transfected with pT6U3-DTA, pGAVPO, pTetR-KRAB and pCDNA3.1-hrGFP, were illuminated by blue light with a spatial pattern using a printed mask with a specific image (local illumination) or with no pattern (global illumination) in the presence of Dox, or were kept in darkness without Dox addition (Dark). The image of hrGFP fluorescence was taken 48 h after transfection. The orange circle indicated the glass bottom of the dish, where the cells were attached. An empty plasmid pT6U3 was used to replace pT6U3-DTA as the negative control. Scale bar, 1 cm. (D) Phase imaging of cells transfected with the pGAVPO, pTetR-KRAB and pT6U3-DTA or pT6U3 empty vector. The engineered cells were cultured in blue light irradiance with Dox or in darkness without Dox, and then were plated with a density of 104 cells in each well of a 96-well plate after 24 h. The cells were cultured for another 72 h, and phase imaging was performed. Scale bar, 100 μm. (E) Quantitative analysis of cell viability by CCK-8. Briefly, 10 μl of CCK-8 solution was added to each well and incubated for 2 h at 37°C. The absorbance at 450 nm was determined using a microplate reader (BioTek). The data were normalized to the cells transfected with control vector and kept in darkness without Dox. The data are shown as the mean ± SD, n = 3.

