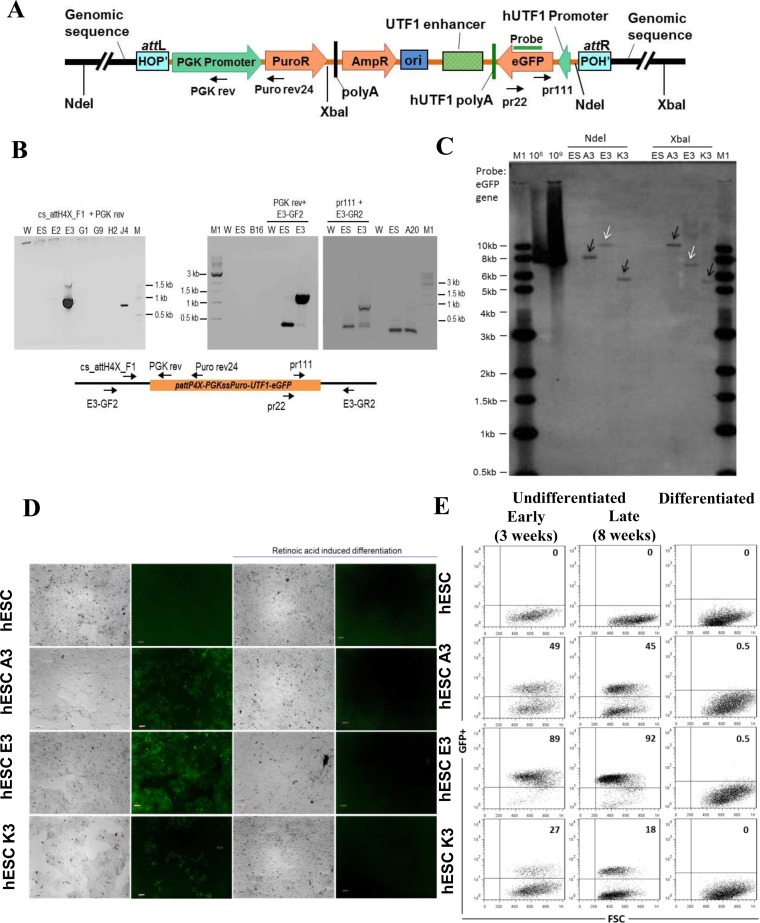
Figure 4.
Targeting attH4X in hESCs with pattP4X-PGKssPuro-UTF1-eGFP. (A) Schematic diagram of pattP4X-PGKssPuro-UTF1-eGFP targeting vector after integration. Locations of primers (Puro rev24, PGK rev, pr111 and pr22) and the Southern probe are indicated. (B) Screening for attH4X x attP4X recombination events in selected hESC clones. Semi-nested PCR with primers cs_attH4X_F1 and PGK rev (for the left junction) using templates obtained with primary PCR (primers cs_attH4X_F1 and Puro rev24). PCR products of the expected size (∼900 bp) were detected in hESC clone E3 (left panel). Confirmatory PCR with genomic locus specific primers were performed for clone E3. PCR products of expected size (∼1100 bp) were obtained in a semi-nested PCR with primer PGK rev and genomic locus-specific forward primer E3-GF2 using templates from a primary PCR (primers Puro rev24 and primer E3-GF2; middle panel). PCR products of expected size (∼1000 bp) were obtained in a semi-nested PCR with primer pr111 and genomic locus specific reverse primer E3-GR2 (for the right junction) using templates from a primary PCR (primers pr22 and E3-GR2; right panel). W, no DNA template control; ES, negative control (genomic DNA from parental cells); M, 100 bp DNA ladder; M1, 1 kb DNA ladder; E2, E3, G1, G9, H2, J4, B16, A20, genomic DNA from puromycin resistant and GFP-positive hESC clones obtained through co-transfection of pattP4X-PGKssPuro-UTF1-eGFP and pEF1α-ss-Int-C3CNLS. (C) Southern blot analysis. Genomic DNA from three hESC clones and parental hESC cells were digested with NdeI or XbaI. Digoxigenin-labeled probe to EGFP was employed. Lanes: M1, 1 kb DNA ladder; 108, 109, copies of linearized targeting vector as positive control; ES, parental DNA; A3, E3 and K3, genomic DNA from targeted hESC clones. White arrow heads indicate fragments of the expected size and black arrow heads indicate extra or unexpected fragments in the targeted clones. (D) Functional test for UTF1 promoter-driven EGFP expression in targeted hESC clones. Fluorescence microscopic analysis of undifferentiated and RA-induced, differentiated parental hES-047 cells and clones A3, E3 and K3. EGFP expression was detected with the undifferentiated hESC clones A3, E3 and K3 (column 2, panels 2, 3 and 4) but disappeared in differentiated progenies (column 4, panels 2, 3 and 4) respectively. Panels in columns 1 and 3 are phase-contrast light micrographs of undifferentiated and differentiated cells, respectively. Magnification 5×; Scale bars 100 μm. (E) FACS analysis for undifferentiated and differentiated hESCs clones Dot plots representing GFP+ cells (upper right quadrant) and GFP− cells (lower right quadrant) for the untargeted hESCs, undifferentiated targeted hESC clones (A3, E3, K3) after 3 weeks (early) and 8 weeks (late) of culturing the cells (left and middle panel) and their differentiated progenies (right panel).

