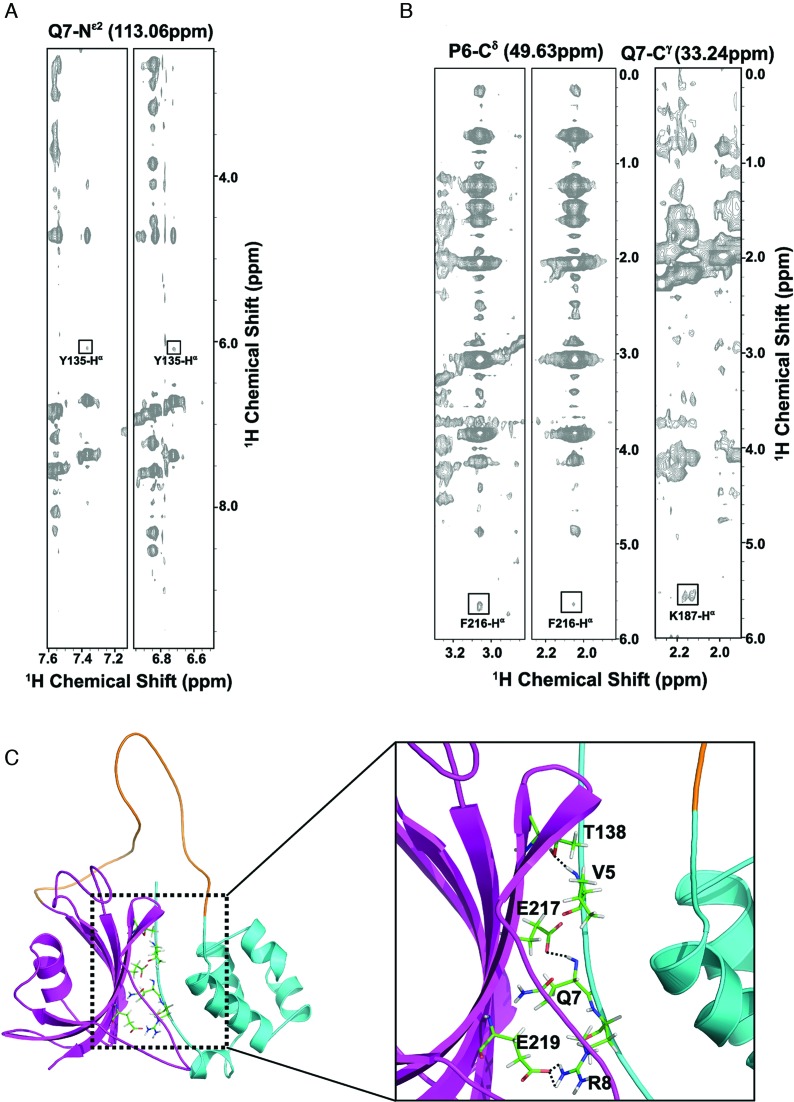
Figure 2.
Molecular interaction between the N-terminal HLH and C-terminal FKBD domains. (A) Representative strips of the 15N-edited three-dimensional (3D) NOESY spectrum of FKBP25 showing NOE cross-peaks between residues on the N-terminal (Gln7) and the C-terminal FKBD (Tyr135). (B) Representative strips of the 13C-edited 3D NOESY spectrum of FKBP25, with NOE cross-peaks between residues on the N-terminal HLH (Pro6, Gln7) and the C-terminal FKBD (Phe216, Lys187). (C) A ribbon representation of the interaction between the HLH and FKBD. The HLH domain and FKBD are highlighted in cyan and pink respectively. Crucial residues forming hydrogen bonds (Val5, Gln7, Thr138 and Glu217) and electrostatic interactions (Arg8, Glu219) are shown as sticks and hydrogen bonds are indicated by dashed lines. Refer online version for color coding.

