Figure 4.
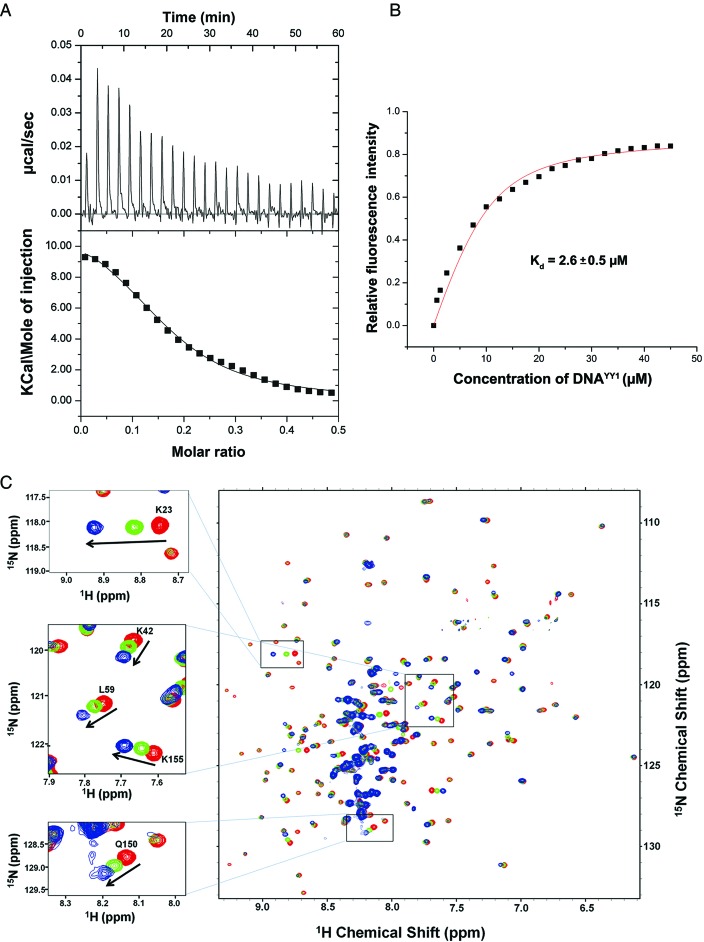
Characterization of FKBP25–DNA binding by isothermal titration calorimetry (ITC), fluorescence quenching and NMR titration. (A) ITC results of the FKBP25 titrated with DNA; the raw data of heat changes (upper panels) and the process curve fit (lower panel) are shown for 0.1 mM of 23 bp dsDNAYY1. (B) The relative fluorescence intensity [(Fo-F)/Fo] of 5 μM FKBP25 is shown as function of DNAYY1 concentration, F and F0 are the fluorescence intensities at 342 nm in absence and presence of DNA respectively. Plot was used to estimate binding constant of FKBP25–DNAYY1 interaction. (C) The overlaid TROSY-HSQC spectra of FKBP25 without (red), with 1:1 (green) or 1:2 (blue) dsDNAYY1; the spectra show a gradual shift in some cross-peaks on DNA binding. CSPs of some residues are zoomed and shown in a box. Refer online version for color coding.

