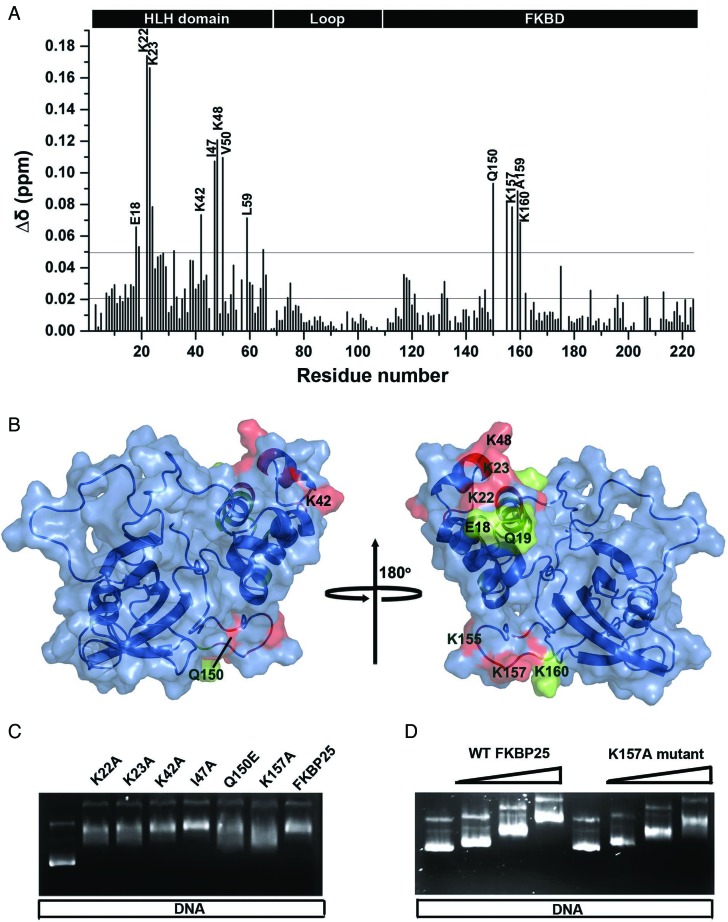
Figure 5.
DNA-binding surface in FKBP25 revealed by NMR. (A) Weighted CSPs for the 15N and 1H resonance of FKBP25 after DNA binding; the lower black line represents the average CSP while upper black line is the sum of average CSPs and standard deviation. (B) DNA-binding surface of FKBP25 mapped by CSP results represented in the surface representation; the residues having CSP more than 0.07 are represented in red while those showing CSP between 0.07 and 0.05 are shown in green. (C) Gel shift assay of the wild-type FKBP25 and mutants. Lane 1 had pSUMO plasmid DNA alone while other lanes had plasmid DNA incubated with wild-type or mutant FKBP25 in 1:250 molar ratio. (D) Gel retardation of the plasmid DNA in increasing concentrations of wild-type or K157A mutant FKBP25 in DNA to protein molar ratio 1:0, 1:25, 1:125 and 1:250. Refer online version for color coding.

