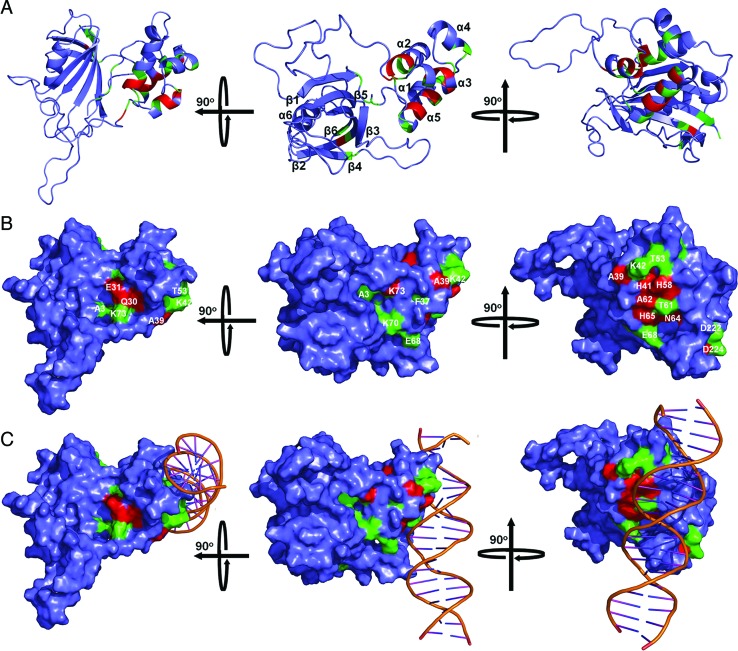
Figure 7.
Mapping of the YY1-binding site in FKBP25. The mapped YY1-binding site in FKBP25 is presented either in a cartoon (A) or in a surface representation (B). The model (in the middle panel) has been rotated 90° either on the horizontal axis (left panel) or on the vertical axis (right panel) to show the complete binding site. The YY1-binding site is indicated and the residues having CSP more than 0.15 are represented in red while those showing CSP between 0.07 and 0.15 are shown in green. (C) Model of the FKBP25–DNA complex showing the YY1-binding sites. A portion of the YY1-binding site overlaps with the DNA-binding site (middle panel) but the major section of the YY1-binding site does not overlap with the DNA-binding site of FKBP25 (left panel and right panel). Refer online version for color coding.

