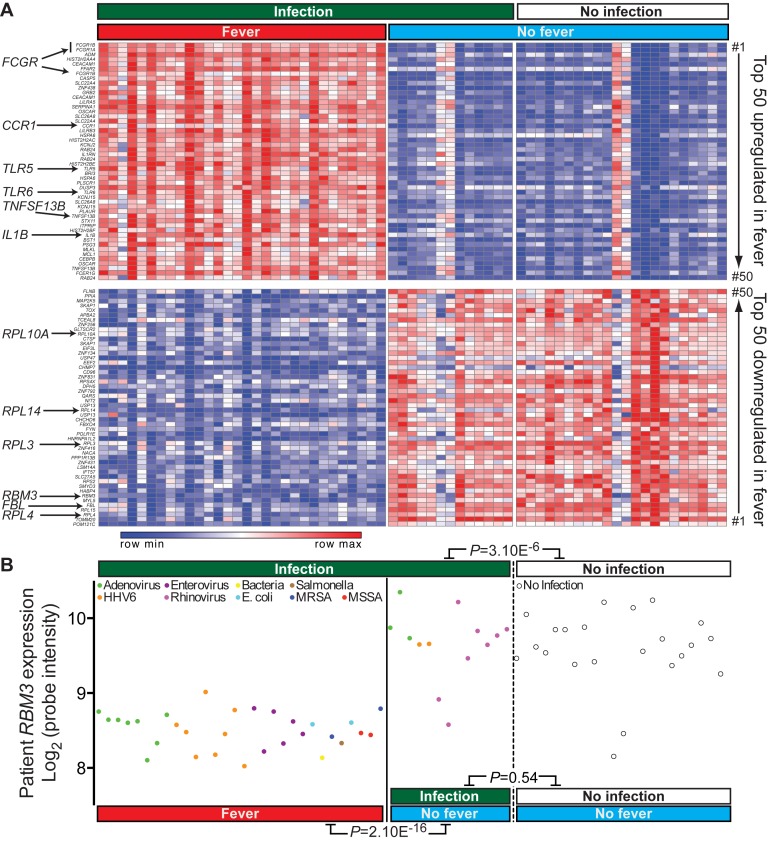
Figure 1.
Differential gene expression in febrile and non-febrile patients. (A) Heatmap showing top 50 most upregulated (red) and downregulated (blue) genes in 30 febrile patients compared to 35 non-febrile controls. (B) Re-analysis of RBM3 expression from Hu et al., 2013 (18) in 30 febrile and 35 non-febrile patients.

