Figure 5.
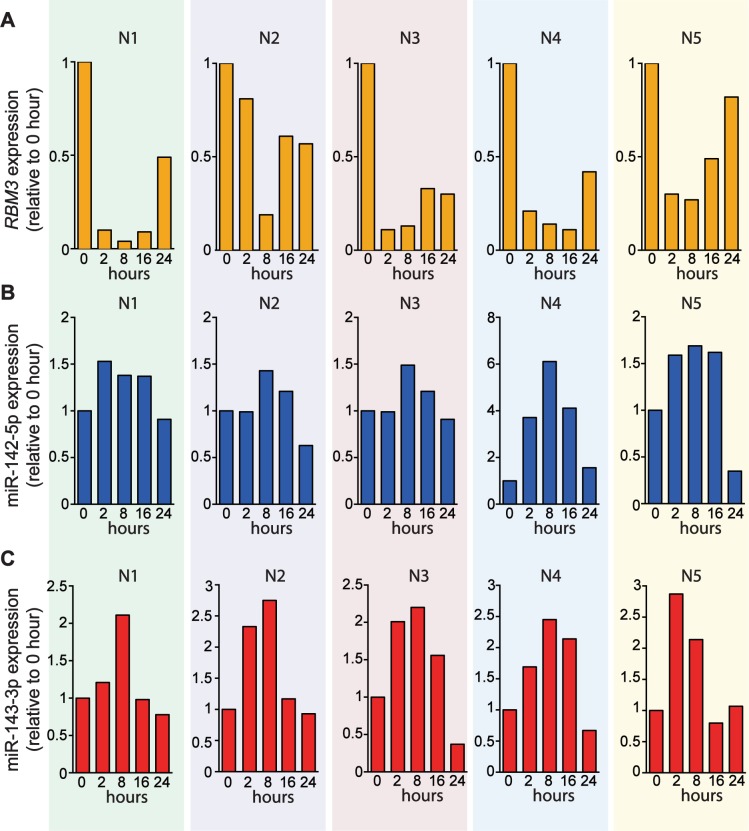
Temporal changes of RBM3, miR-142–5p and miR-143 expression in PBMCs exposed to 40°C over a 24 h time course. (A) Expression of RBM3 mRNA in PBMCs by RT-qPCR (n = 5). (B) Expression of miR-142–5p and (C) miR-143 in PBMCs by Taqman miRNA assays (n = 5). Fold change was measured relative to 0 h. N1–N5 denote five healthy individuals recruited for this experiment.

