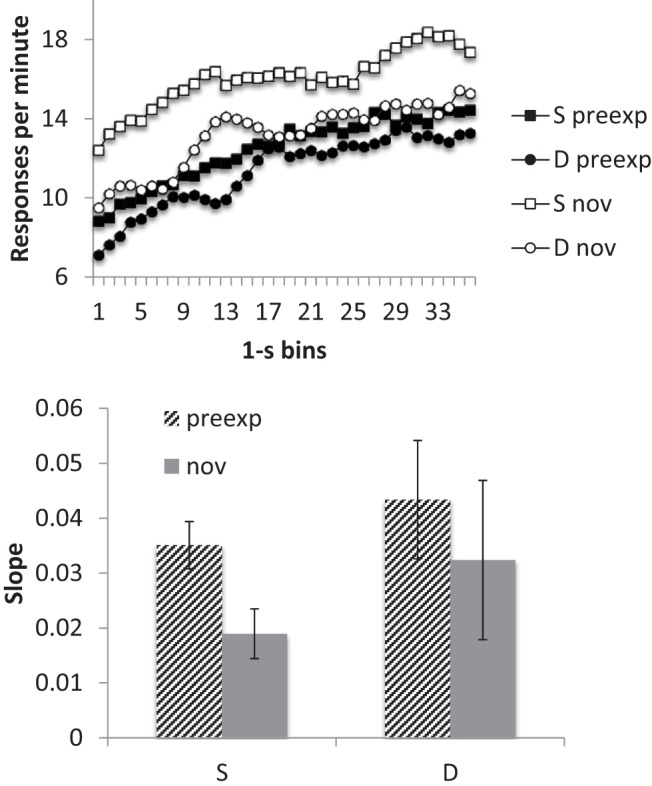
Figure 8.

Group mean scores for Group Same (S) and Different (D) for the preexposed (pre) and novel (nov) CSs from the conditioning sessions (11–14) of Experiment 3b. Upper panel: Smoothed response rates in each 1-s bin. Lower panel: Slopes. Bars show standard error of the mean.
