
Fig. 2.
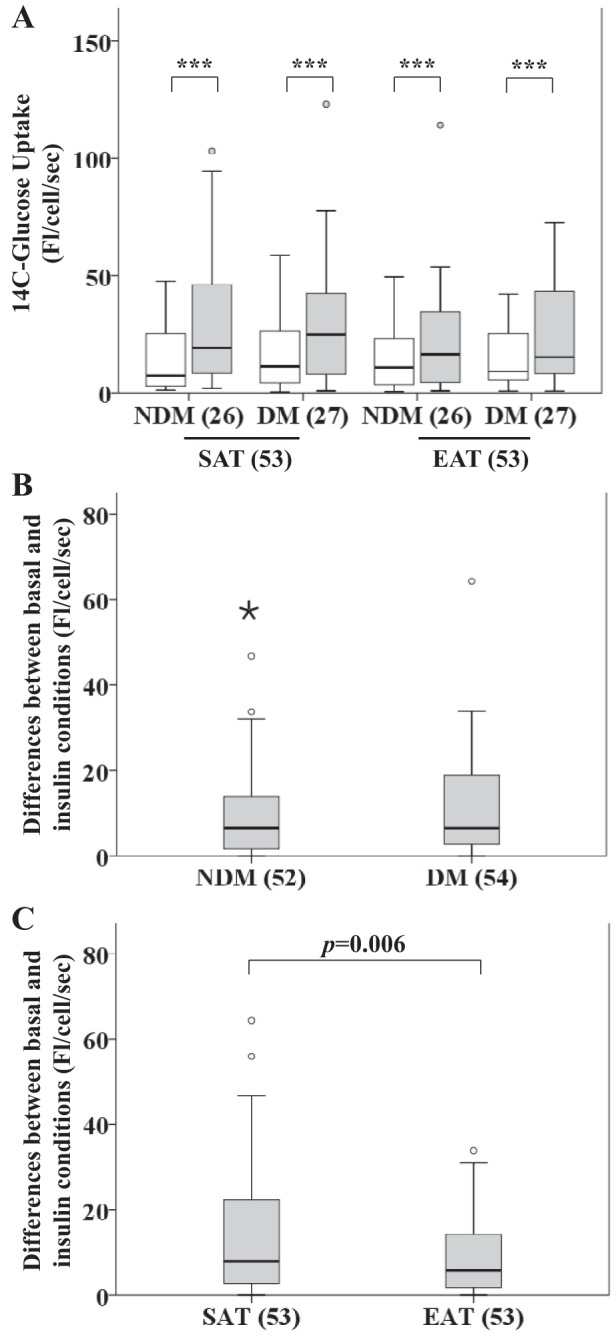
Insulin-stimulated glucose uptake in SAT and EAT from HF patients with or without DM. No. of patients is indicated in parentheses. A: glucose uptake in SAT and EAT from the same patients. B: difference between basal and insulin conditions based on disease status. C: difference between basal and insulin conditions based on tissue type. Statistical analysis: for each tissue type and disease status in A, differences between basal measurements of glucose uptake and corresponding measurements when insulin was used were assessed using Wilcoxon tests. ***P < 0.001. For a better visualization of the results, we excluded a value in the insulin-stimulated condition in the EAT + DM group (200.06). In B, the difference between basal and insulin conditions was compared based on disease status using a nonparametric 2-way ANOVA. For a better visualization of the results, we excluded a value in the DM group (110.83). In C, the difference between basal and insulin conditions was compared based on tissue type using a nonparametric 2-way ANOVA. P value is as indicated. For a better visualization of the results, we excluded a value in the EAT group (110.83). Open bars, basal; gray bars, insulin.