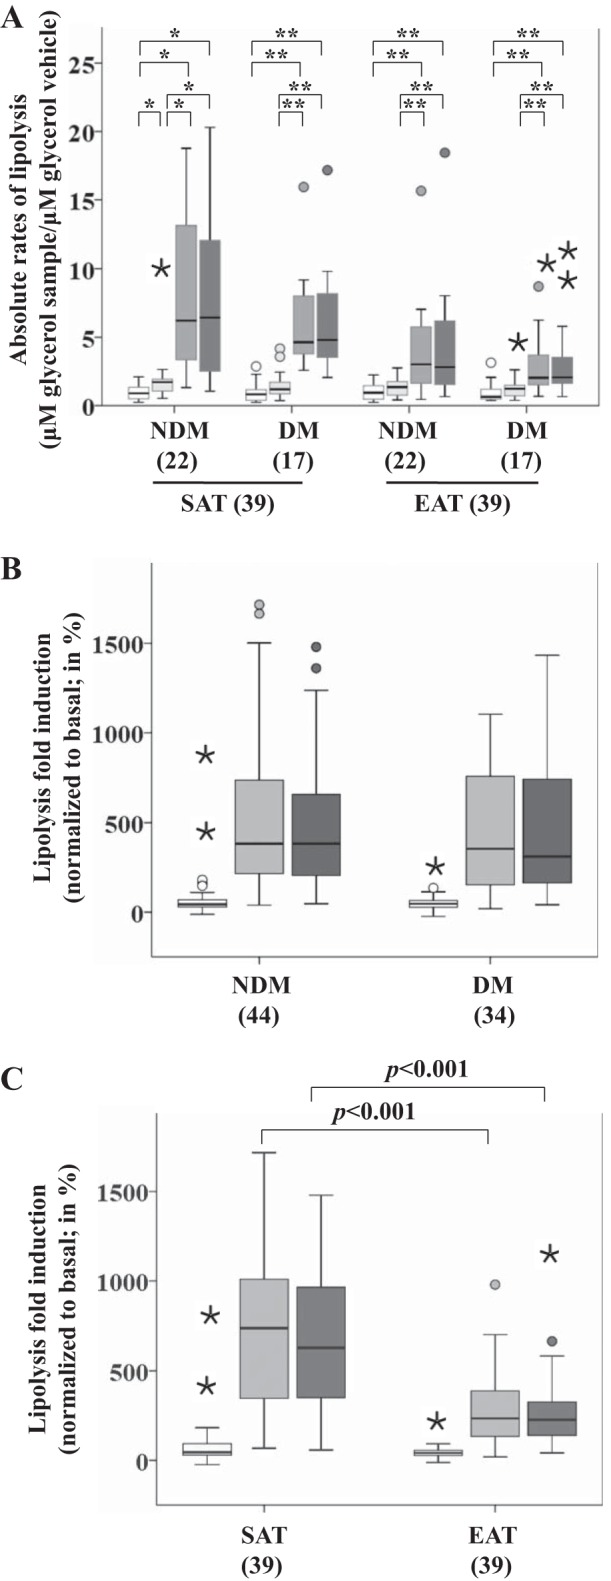
Fig. 4.

Isoproterenol-stimulated lipolysis in SAT and EAT from HF patients with or without DM. No. of patients is indicated in parentheses. A: absolute rates of lipolysis in each group. B: lipolysis fold induction based on disease status. C: lipolysis fold induction based on tissue type. Statistical analysis: for each tissue type and disease status in A, differences between basal and the measurements corresponding to the different stimuli were done using Friedman tests and subsequent post hoc tests, employing Dunn's correction for multiple comparisons, **P < 0.01, *P < 0.05. The changes in lipolysis in B and C were compared between factors (disease status and tissue type) using a nonparametric 2-way MANOVA. P value is as indicated. Open bars, basal; light gray bars, insulin; gray bars, isoproterenol; dark gray bars, insulin + isoproterenol.
