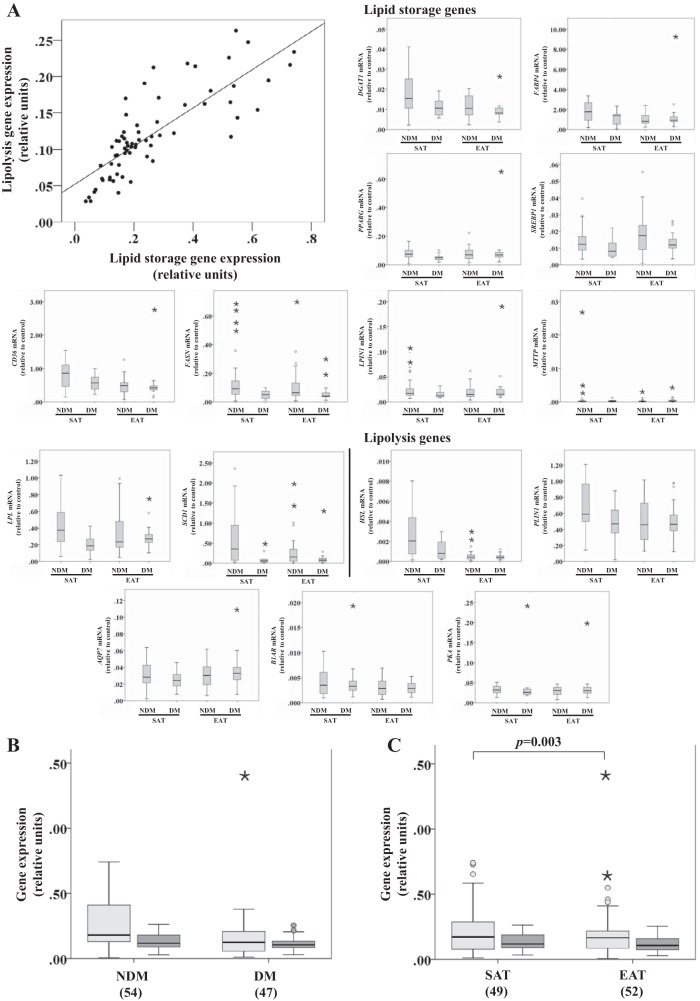
Fig. 5.
Lipid storage and lipolysis-related gene expression in SAT and EAT from HF patients with or without DM. No. of patients is indicated in parentheses. Different genes were averaged out into 2 variables: lipid storage [diacylglycerol O-acyltranferase 1 (DGAT1), fatty acid-binding protein 4 (FABP4), peroxisome proliferator-activated receptor-γ (PPARG), sterol-regulatory element-binding protein 1 (SREBP1), cluster of differentiation (CD36), fatty acid synthase (FASN), lipin 1 (LPIN1), microsomal triglyceride transfer protein large subunit (MTTP), lipoprotein lipase (LPL), and stearoyl-CoA desaturase 1 (SCD1)] and lipolysis [hromone-sensitive lipase (HSL), perililpin (PLIN1), aquaporin-7 (AQP7), β1-adrenergic receptor (B1AR), and PKA]. Gene expression was normalized using the reference gene ACTB that was selected based on our previous results demonstrating that it does not change under these conditions. A: correlation between lipid storage and lipolysis gene expression. B: lipid storage and lipolysis gene expression based on disease status. C: lipid storage and lipolysis gene expression based on tissue type. Statistical analysis: correlation between lipolysis and lipid storage in A was evaluated using the Spearman correlation coefficient; n = 74, ρ(67) = 0.839, P < 0.001. Lipid storage group in B and C was compared between factors (disease status and tissue type) using a nonparametric 2-way ANOVA. P value is as indicated. Light gray bars, lipid storage; dark gray bars, lipolysis.

