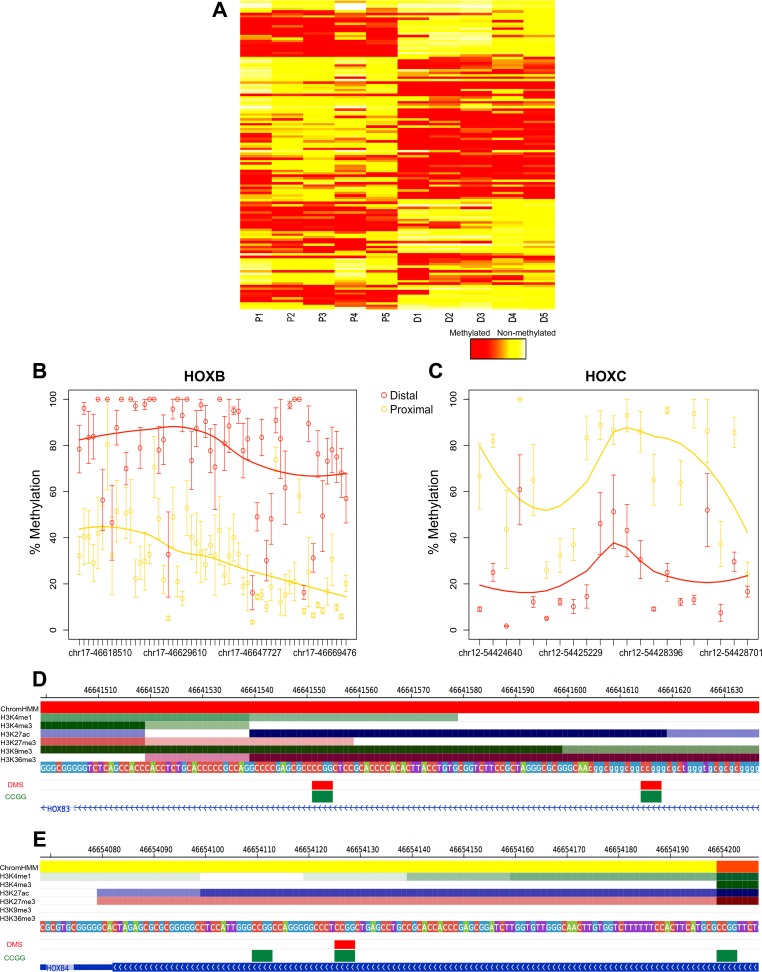
Fig. 4.
Site and region-specific differential methylation between proximal and distal regions: HELP-tagging assay. DNA methylation values of DMRs using a color scale from red (high DNA methylation) to yellow (low DNA methylation). Columns represent samples (P, proximal; D, distal), and rows represent all CCGG sites that fall within each DMR (A). Scatter plot illustrating individual CCGG loci (circles) contained within DMRs mapping to HOXB genes (B) and HOXC genes (C) between proximal (yellow) and distal (red) samples. Data points are presented as means ± SE. DMS mapping to the active TSS region (red) of HOXB3 (D), active enhancer region (yellow) of HOXB4 (E), as well as the CHIP-seq profiles of the set of 6 histone marks assayed in colonic mucosa are shown. Below the histone marks, DMS (red) and all CCGG sites (green) mapping to each gene segment are also illustrated.

