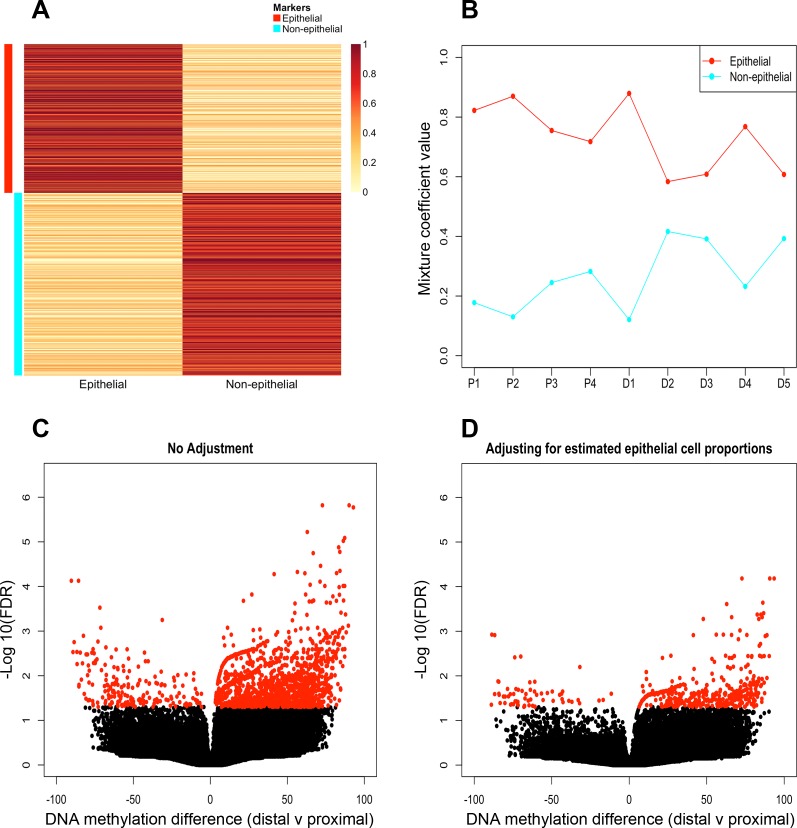
Fig. 6.
Identification of DNA methylation differences in proximal and distal colonic mucosa following deconvolution. A marker map illustrating the mean methylation of the epithelium (red) and nonepithelium (cyan) cell-type marker sites are annotated by colored bands (A). Profile plot illustrating cell proportion estimates of epithelial (red) and nonepithelial (cyan) populations in whole biopsy samples (B). Volcano plots of differential DNA methylation analysis pre- (C) and postdeconvolution (D). x-Axis, DNA methylation difference between distal and proximal samples; y-axis, −Log10 for each nonsignificant (black) and significant (red) (Benjamini-Hochberg adjusted P value of 0.05) site of whole biopsy samples.

