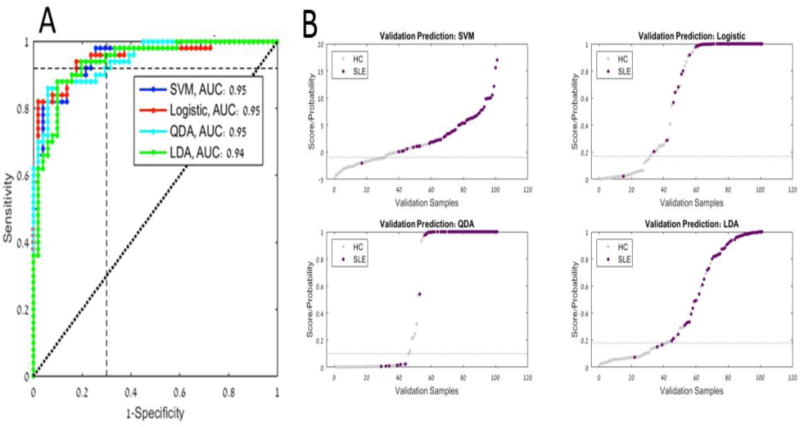
Figure 2. A) ROC curves for the four classification models on validation data set, indicating test performance at selected threshold. B) Validation Prediction Distribution.

Grey points indicate samples classified as healthy control and purple points indicate samples classified as SLE.
