
Fig. 5.—
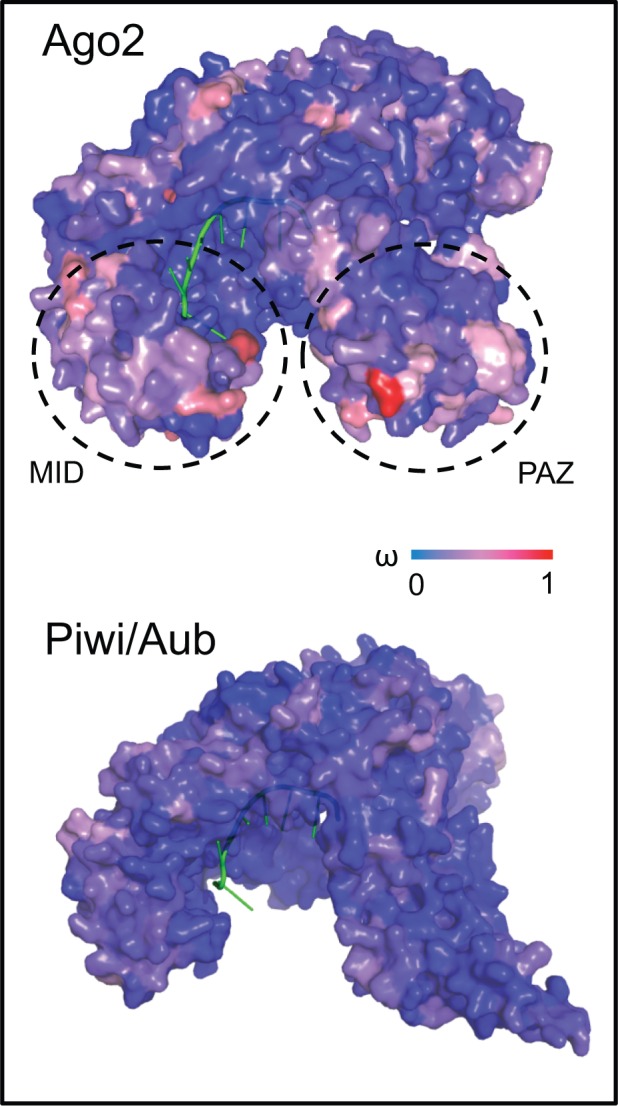
Evolutionary rates mapped onto 3D structures of Ago2 and Piwi/Aub, each binding a sRNA guide. In Ago2, hotspots of evolution are seen at the entrance of the RNA binding pocket; in contrast, evolutionary rate (ω) across the structure of Piwi/Aub is uniformly low. The MID and PAZ protein domains are indicated for Ago2.