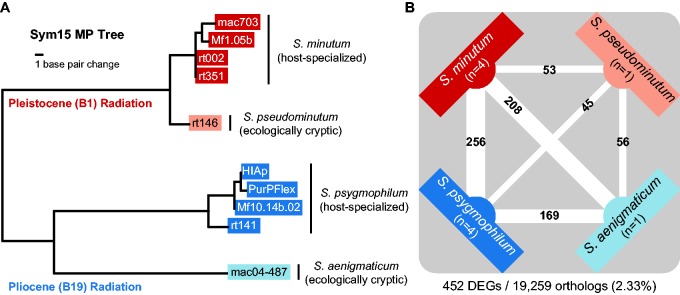
Fig. 1.—
(A) Phylogenetic relationships and ecologies for the Clade B Symbiodinium species used in this experiment. The maximum parsimony tree was generated based on microsatellite Sym15 flanker region data from Parkinson, Coffroth, et al. (2015) and the methodologies described therein. (B) The numbers of differentially expressed genes (DEGs) between Clade B Symbiodinium species. Counts are placed on the lines connecting the two species being contrasted. Line thickness is scaled by the number of DEGs. Also depicted are the numbers (n) of cultured strains (clonal cell lines) included per species. Counts below the diagram show the total number of genes differentially expressed in at least one species and the total number of comparable orthologs across all species.

