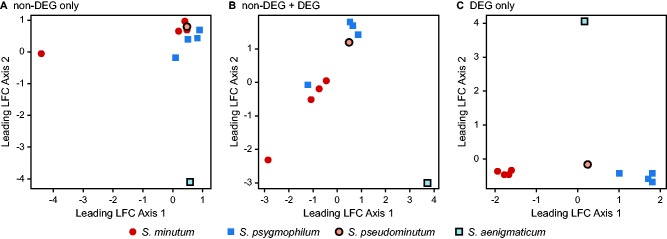
Fig. 3.—
Multidimensional scaling plots depicting sample clustering along the primary and secondary leading log2-fold change (LFC) axes using the following expression values: (A) Only non-DEGs (18,907), (B) non-DEGs and DEGs together (19,359), and (C) only DEGs (452). No border = host-specialized; border = ecologically cryptic; circles = Pleistocene (B1) radiation, squares = Pliocene (B19) radiation.

