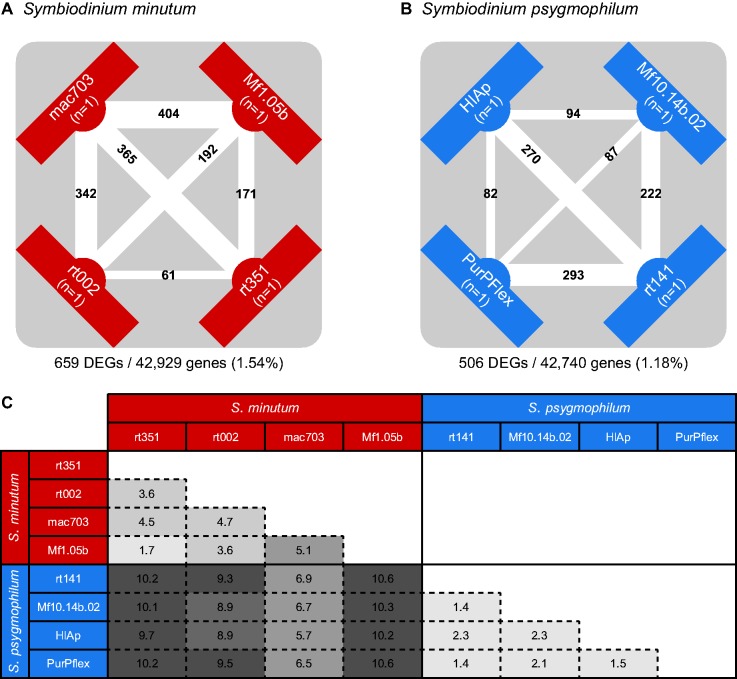
Fig. 4.—
The numbers of DEGs among strains within (A) Symbiodinium minutum and (B) Symbiodinium psygmophilum. Counts are placed on the lines connecting the two strains being contrasted. Line thickness is scaled by the number of DEGs. Counts below the diagram show the total number of genes differentially expressed in at least one strain and the total number of comparable genes (ORFs) across all strains. (C) Distances between pairs of strains based on Euclidean distance (×103) of expression estimates for all pairwise comparisons of S. minutum and S. psygmophilum strains. Boxes are shaded such that light coloration reflects relatively small values and dark coloration reflects relatively large values.

