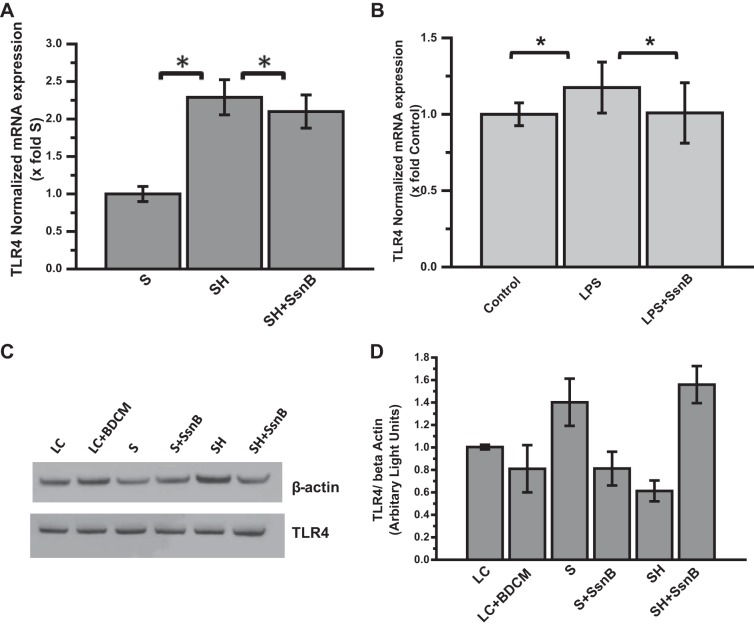
Fig. 11.
SsnB treatment does not reduce TLR4 gene expression or protein concentration. A: qRT-PCR analysis of mRNA expression of TLR4 from liver homogenates of S, SH, and SH+SsnB mice, normalized against S (*P < 0.05). B: qRT-PCR analysis of mRNA expression of TLR4 from control (untreated), LPS-treated, and LPS+SsnB-treated mouse primary hepatic macrophages, normalized against control (*P < 0.05). C: Western blot analysis of β-actin and TLR4 protein levels in the liver homogenates of lean control (LC), LC+bromodichloromethane (BDCM), S, S+SsnB, SH, and SH+SsnB groups. D: immunoreactive band analysis of TLR4 normalized against β-actin. y-Axis depicts the TLR4-to-β-actin ratio for LC, LC+BDCM, S, S+SsnB, SH, and SH+SsnB groups.

