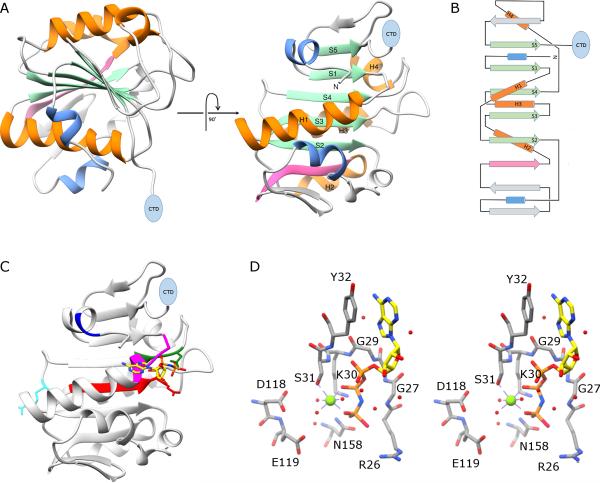
Figure 2.
X-ray crystal structure of the N-terminal ATPase domain of gp16. A) Two views of a ribbon diagram of gp16. β-sheets and α-helices on the conserved ASCE core are shown in green and orange, respectively, and are numbered in the right image of the panel. Additional strands and helices characteristic of the HerA/FtsK clade of the ASCE superfamily are shown in pink and blue, respectively, and a blue oval indicates the position of the C-terminal OB domain. B) Topology diagram of gp16; colors and symbols are the same as in (A). C) The proposed adenine binding motif is shown in blue, the Walker A motif in magenta; and the Walker B motif in red. The proposed phosphosensor, catalytic glutamate, and arginine finger are shown as stick figures colored green, red and cyan, respectively. The substrate analog AMP-PNP is shown as a stick figure; atoms are colored by element except for carbon, which is colored yellow to facilitate viewing. D) stereo-diagram of active site residues in gp16; some backbone atoms have been removed to facilitate viewing. Magnesium and waters are shown as green and red spheres, respectively.

