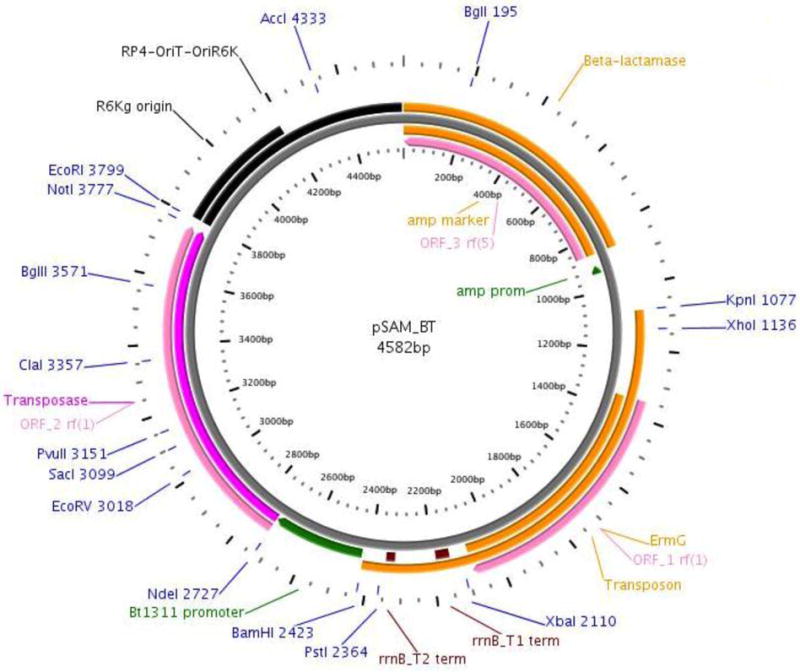
Figure 1.

Map of the pSAM_Bt vector generated using Plasmapper. The three ORFs on the vector are denoted in pink. Antibiotic markers denoted in orange. The Amp and BT_1311 promoter regions are denoted in green. Unique restriction enzyme cut sites are labeled. (21)
