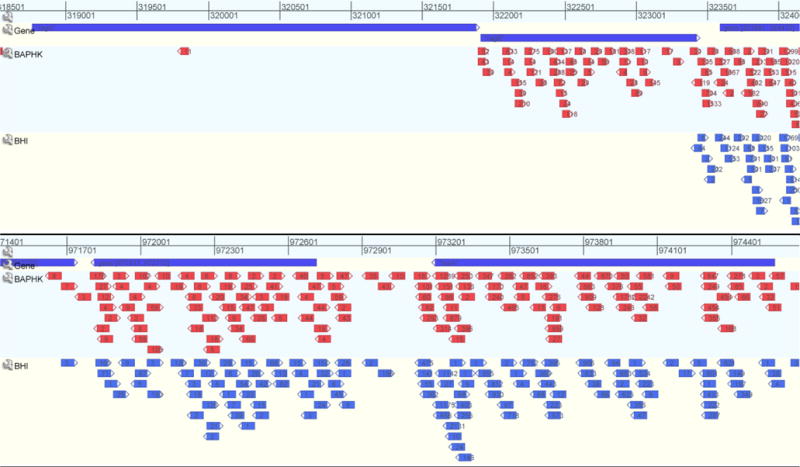
Figure 3.

Using GenomeView for visualization of Tn-seq data. BED files (for Tn-seq data) and GenBank files (for NCBI) were uploaded to generate tracts, in which the insertion locus becomes an arrow and the numbers inside the arrow are the reads for that given insertions under the experimental condition. Top tract in blue are genes of the P. gingivalis ATCC 33277 genome from NCBI. Subsequent tracts are the BAPHK-based library followed by BHIHKSbcStgC- based condition. Under these conditions, insertions into an ISPg3 element and tnaA stay relatively constant (top), while insertions into ragA/ragB –operon show a BAPHK-essential gene, one with reduced fitness under BHIHKSbcStgC condition relative to BAPHK, as well as an unaffected gene (bottom).
