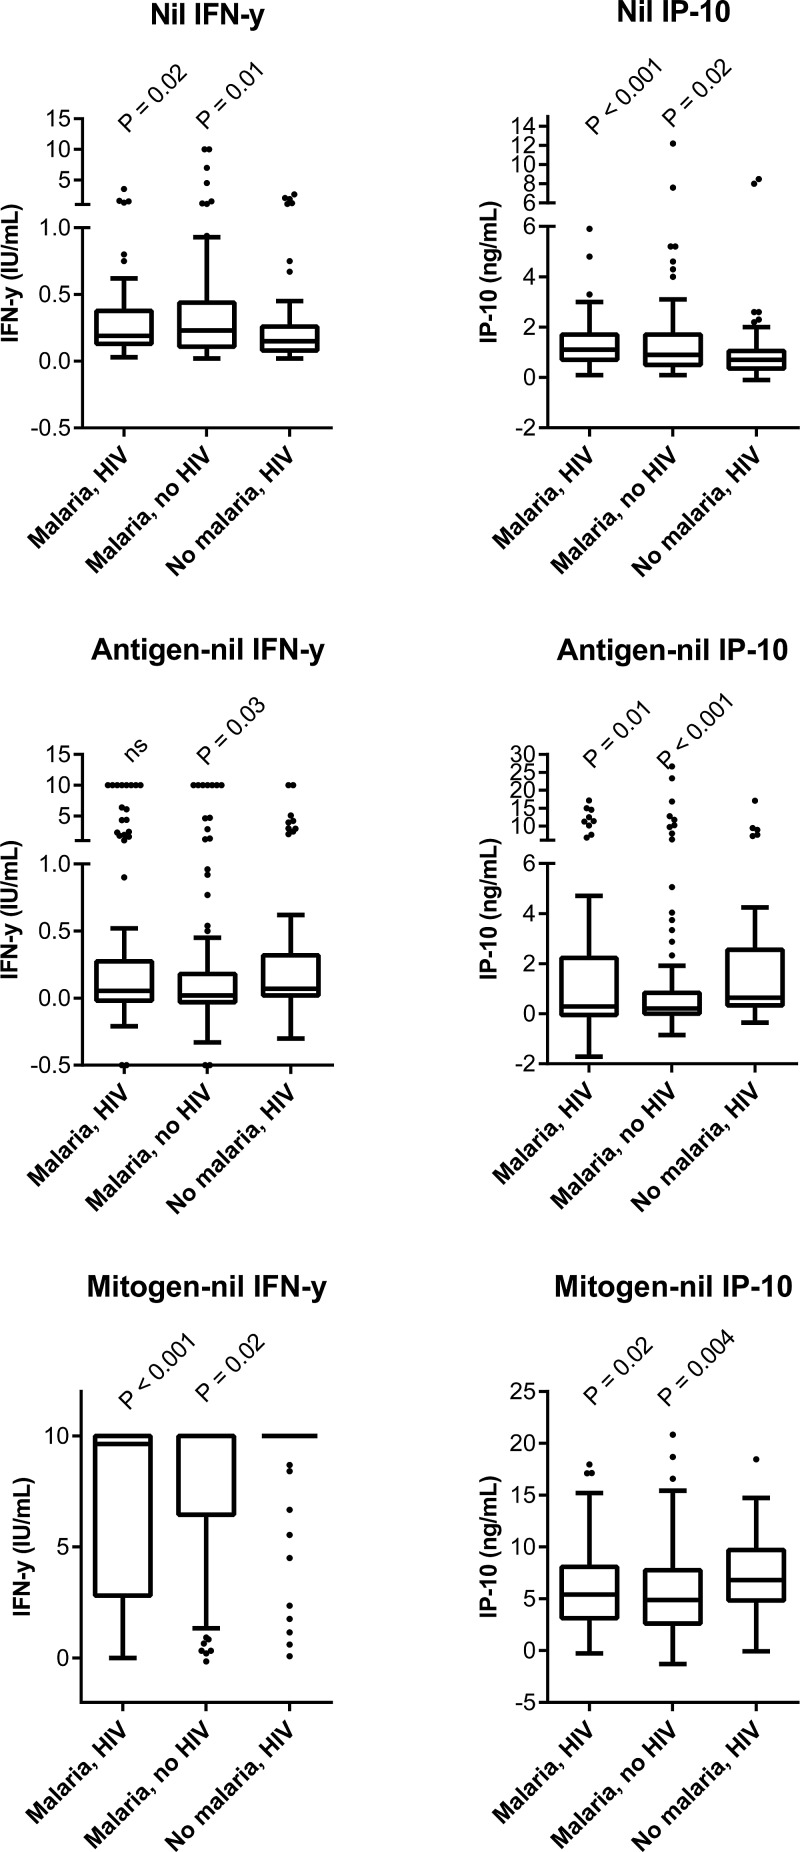
Figure 1.
Box-and-whiskers plot (Tukey) showing cytokine levels at enrollment (day 0). P values reflect comparison of the malaria groups to the non-malaria-HIV-infected group (Mann–Whitney U). The antigen levels depend on the Mycobacterium tuberculosis exposure of the group, whereas the nil and mitogen response reflect the patients' immune status. HIV = human immunodeficiency virus; ns = not significant. The Quantiferon test has an upper detection limit at 10 IU/mL. In general, we found higher nil levels and lower response to mitogen stimulation in the malaria-infected groups compared with the non-malaria-HIV-infected group.

