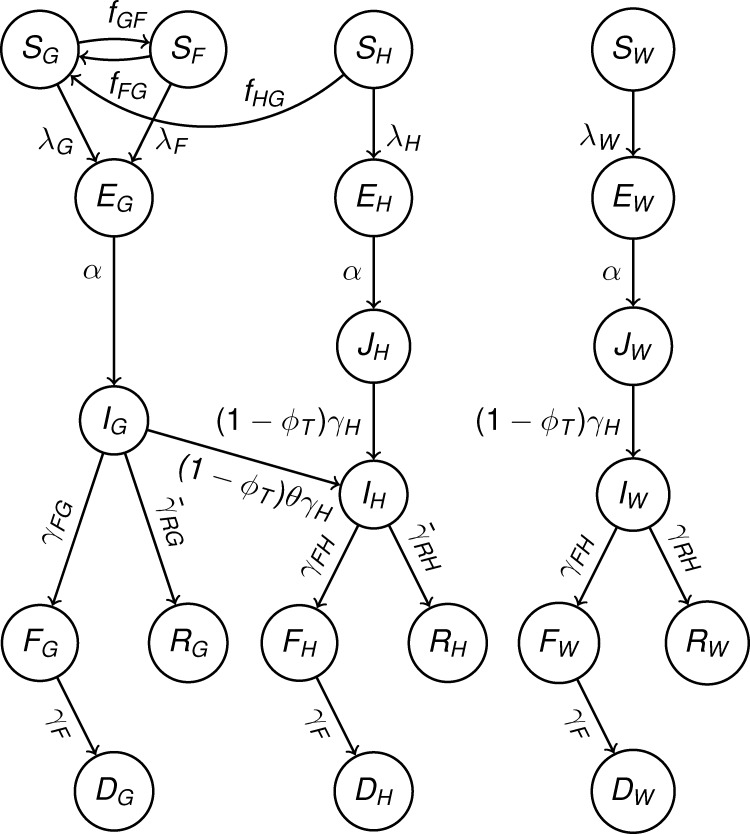
Figure 1.
Model diagram of compartmental epidemiological classes (circles) with rates of movements between each class (arrows). Further details are presented in the Methods section, and corresponding model equations are presented in Supplemental Information.

