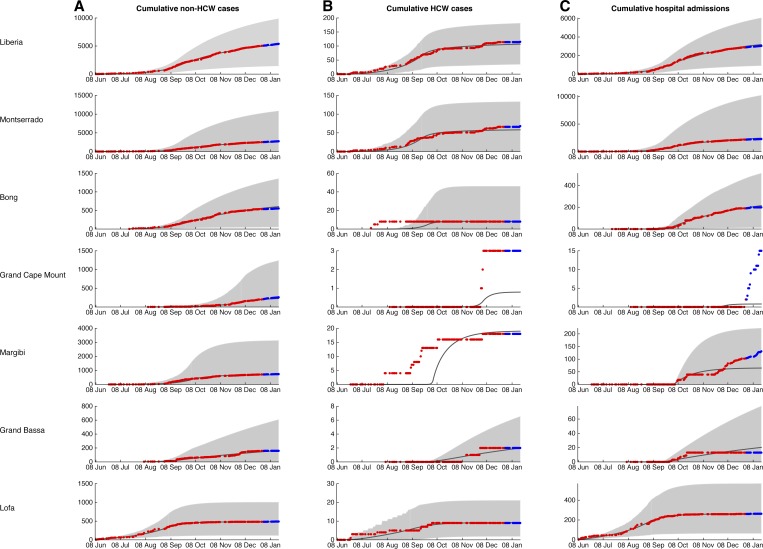
Figure 2.
Model fits. Deterministic trajectories of the model fitted to data from June 9, 2014 to December 30, 2014 (black line) with confidence intervals generated from over 1,000 runs of the stochastic version of our model (gray fill). Parameter values are displayed in Table 1. Data points for each county used to fit the model (red) and for validation (blue) are overlaid. Note that for Bong and Margibi counties, transmission to health-care workers increased before any Ebola patients being admitted to hospitals in those counties.

