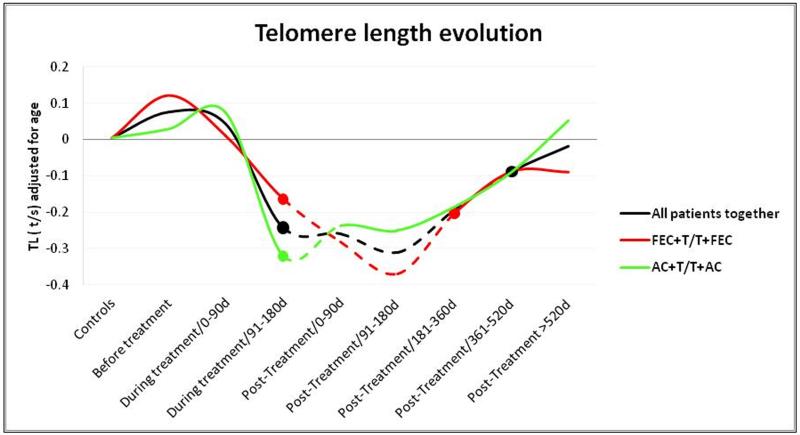
Figure 2.
Telomere-length evolution during treatment and after treatment. Mann Whitney test was used to determine significant differences between controls and the different subgroups. The discontinuous lines represent significantly shortened telomeres compared to controls for all the patients together (black line) and for the two major drug schedules (red and green lines).

