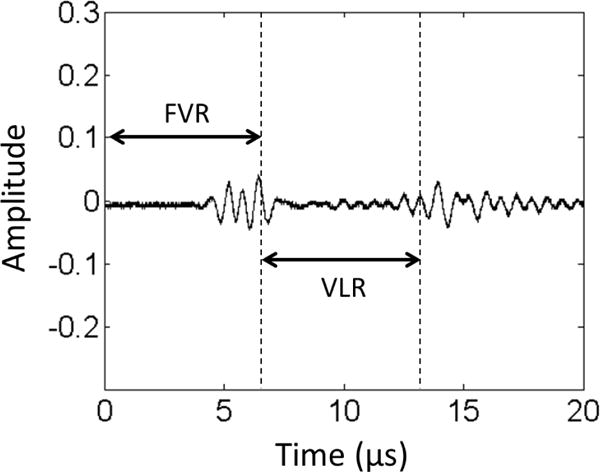
Figure 5.

Control waveform of cavitation monitor. The two bursts in the figure are the reflected signals from the front vessel wall (left) and rear vessel wall (right), respectively. The corresponding temporal zones of the Front Vessel Region (FVR) and Vessel Lumen Region (VLR) can be determined by these two reflections.
