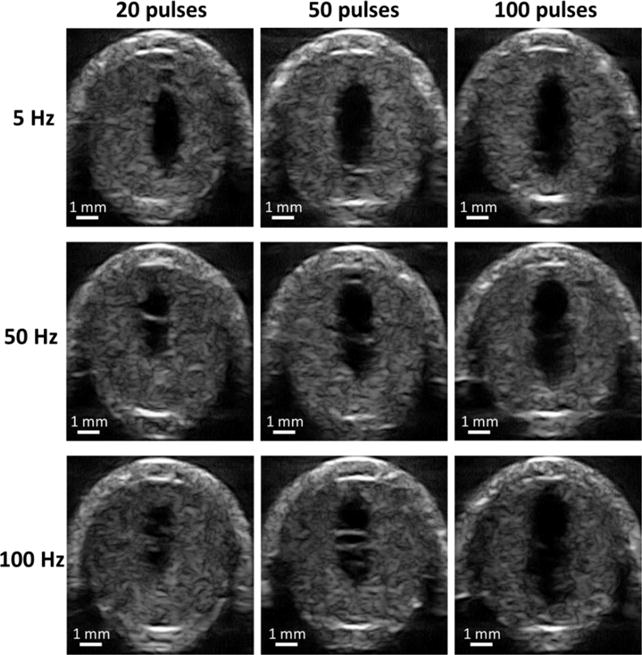
Figure 8.

Representative high-resolution ultrasound images of flow channel generated from each treatment parameter combination. The generated flow channels show as the hypoechoic zones inside clots. Ultrasound propagated from the top to the bottom of the images.
