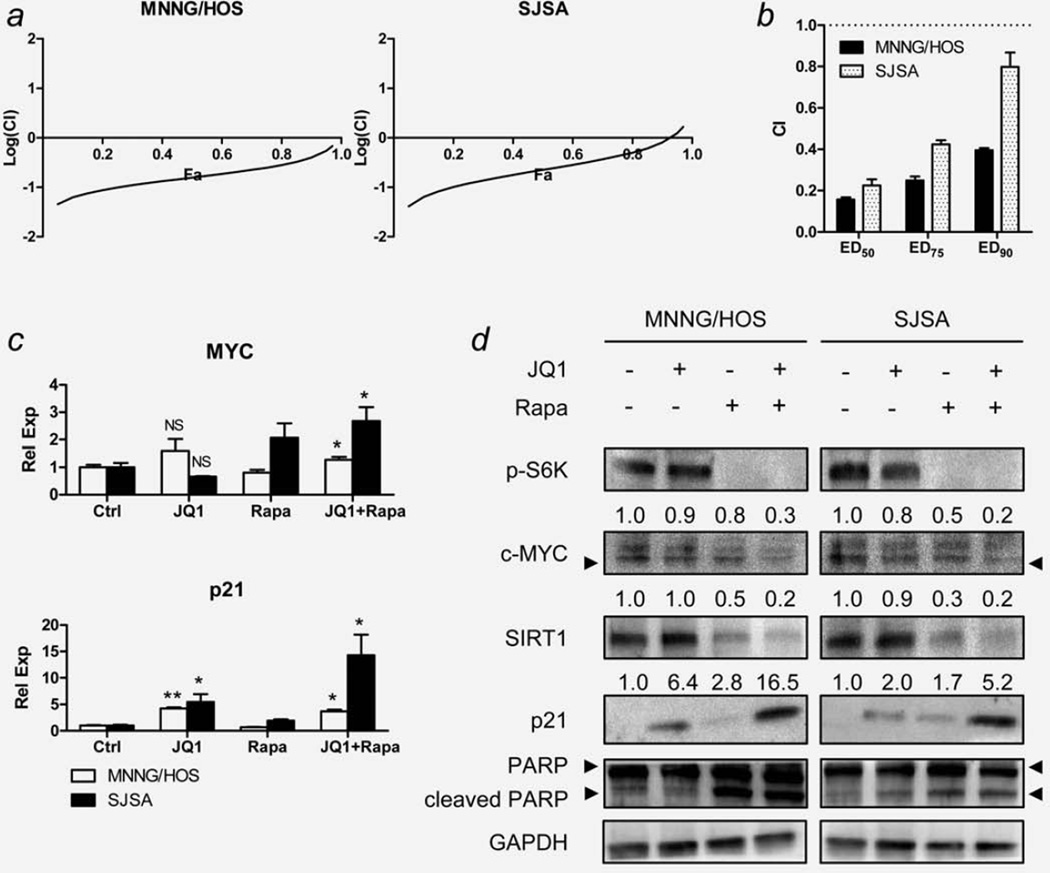
Figure 4.
Effect of combination of JQ1 and rapamycin on OS cells in vitro. MNNG/HOS and SJSA cells were grown in various concentrations of JQ1 and rapamycin, and the dose–response relationship was determined after 48 hr by LDH assay (Supporting Information Fig. S2a and Supporting Information Table S3). (a) Fraction affected (Fa)-Combination index (CI) plot for MNNG/HOS and SJSA cells exposed to JQ1 and rapamycin. Fa-CI plots were generated using selected data points with constant concentration ratio of JQ1 and rapamycin (1:1). (b) Changes in CI values at different drug concentrations (ED50, ED75 and ED90) of JQ1 and rapamycin in MNNG/HOS and SJSA cells. Data represent mean CI ± standard deviation (SD). (c) The effect of JQ1 (7.5 µM) and/or rapamycin (12.5 nM) on the mRNA level of c-MYC and p21 genes of MNNG/HOS and SJSA cells at 12 hr exposure. Expression levels of c-MYC and p21 were normalized to the expression level of GAPDH. Data represent mean relative expression ± SD. Asterisks (*) indicate p-value less than 0.05 (*) or 0.001 (**) by t-test. (d) Representative Western blot images showing changes in protein levels of the selected genes in the same condition as described in panel (c). Numbers indicate relative band intensity of each gene normalized to the intensity of the genes in control (1.0). GAPDH was used as a loading control. NS: not significant.

