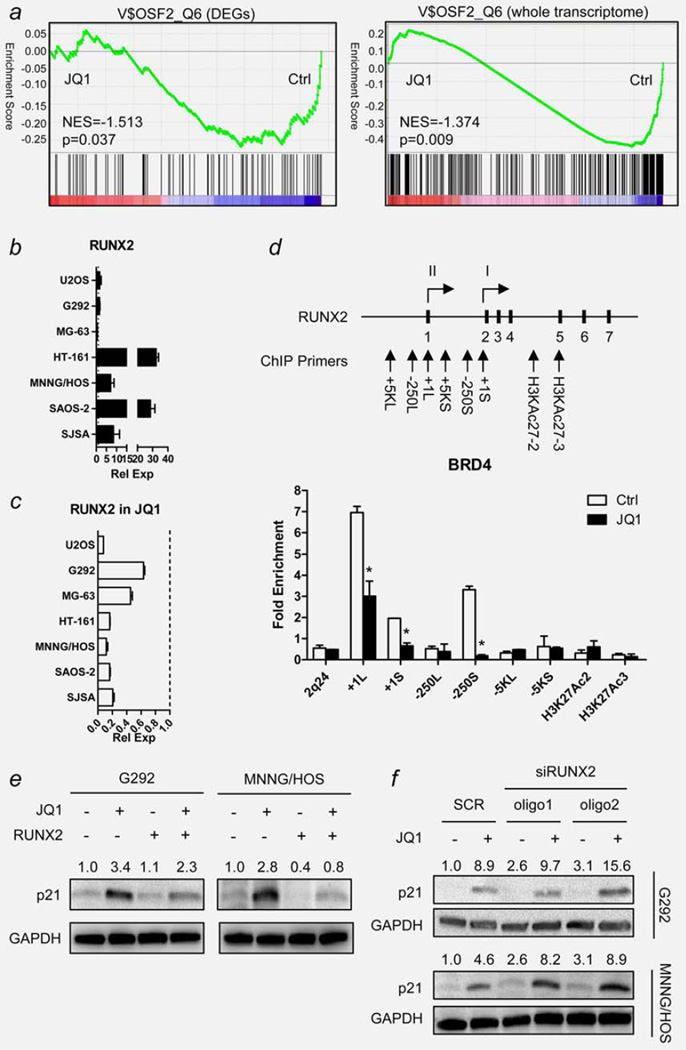
Figure 6.
RUNX2 as a mediator of JQ1 activity in human OS cells. (a) Gene set enrichment analysis (GESA) plot showing downregulation of genes with RUNX2 binding motifs by JQ1 treatment in MNNG/HOS cells. Green lines represent the running enrichment score for the gene set as it progresses down the ranked list (x-axis) according to their differential expression score. Black vertical lines show the location of the members of the gene set. GESAs were done using either the differentially expressed genes (DEGs, left) or the whole transcriptome (right) in the gene set. (b) Endogenous mRNA expression level of RUNX2 of seven human OS cell lines measured by qRT-PCR. Data indicate relative mean expression ± standard deviation (SD, error bars). RUNX2 expression level of each cell was normalized to the RUNX2 expression level of hFOB1.19 human osteoblast cells (set to 1.0). GAPDH was used as a loading control. (c) Changes in RUNX2 mRNA expression level of seven human OS cell lines upon JQ1 treatment (7.5 µM, 6 hr). Dotted line indicates the expression level of RUNX2 mRNA of each cell without JQ1 treatment (set to 1.0). GAPDH was used as a loading control. (d) Schematic diagram showing RUNX2 gene and the location of ChIP primers used in the study. Each short, black vertical bar with a number represents one of the seven exons of RUNX2. Two arrows with Roman numerals (I and II) display the location of two transcription start sites. Bar graph below shows enrichment of PCR products from MNNG/HOS cells treated with or without JQ1 (7.5 µM, 6 hr). Data represent relative fold enrichment ± SD. Asterisk (*) indicates p-value less than 0.05 by t-test. (e) Changes in p21 protein level in RUNX2-overexpressing MNNG/HOS cells. Cells were transfected with either empty vector (EV) or pEF-BOS-RUNX2 expression vector (RUNX2). After 48 hr, cells were treated with 7.5 µM JQ1 for 12 hr and harvested for Western blot analysis. Numbers indicate relative band intensity of each gene normalized to the intensity of the genes in control (1.0). GAPDH was used as a loading control. (f) Changes in p21 protein level in MNNG/HOS cells transfected with siRNA oligos against RUNX2. Cells were transfected with either scrambled control oligos (SCR) or two kinds of siRUNX2 oligos (oligo1 and oligo2). After 48 hr, cells were treated with 7.5 µM JQ1 for 12 hr and harvested for Western blot analysis. Numbers indicate relative band intensity of each gene normalized to the intensity of the genes in control (1.0). GAPDH was used as a loading control. NES: normalized enrichment score.

