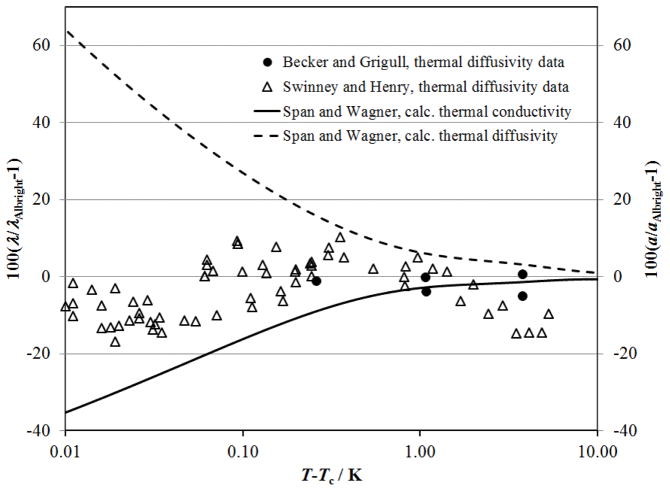
Figure 22.
Deviations in λ and a for the present correlation with thermodynamic properties calculated with the equation of state of Span and Wagner114 relative to the Albright et al. 127 scaled equation of state near the critical temperature, along the critical isochore. The solid line show deviations for thermal conductivity and the dashed line show deviations for thermal diffusivity. Deviations for measured thermal diffusivity data are shown with symbols: △, Swinney and Henry128 ; ●, Becker and Grigull.52

