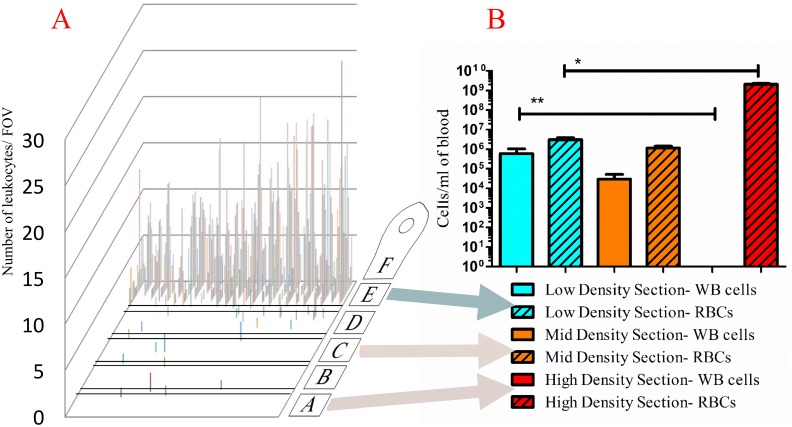
Fig 3. Location of blood components post-centrifugation.
(A) Location and quantity of leukocytes after 4-min separation in density media as counted on disk via microscopy (figure is representative of n = 3). Background image denotes the orientation of the lane and location of the capillary valves. (B) The number of red blood cells and leukocytes extracted from section E, section C, and section A and counted with a Neubauer chamber. Results from three assay disks are shown to demonstrate disk-to-disk reproducibility. (WBCs are significantly enriched in section E versus section A, two-way ANOVA ** = p<0.05; RBC’s are significantly enriched in section A versus section E, * = p<0.05.)

