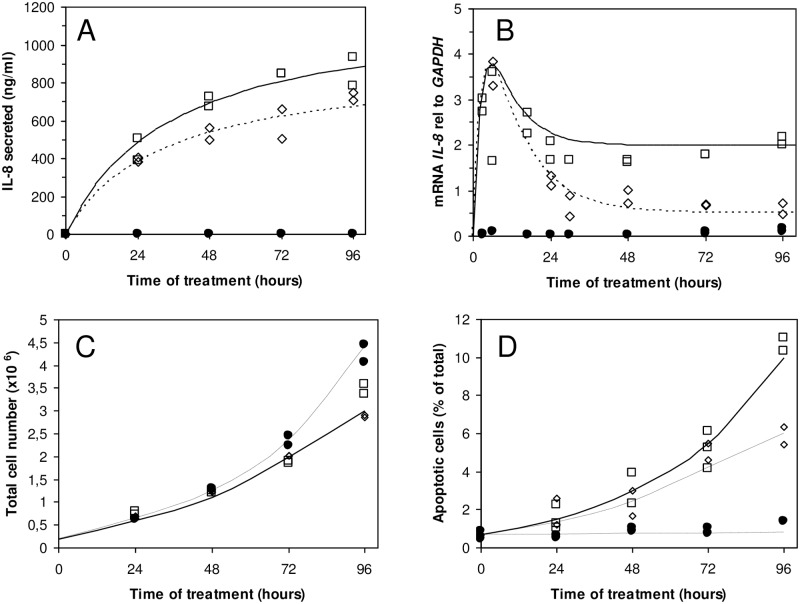
Fig 2. Inflammation in HT-29 cells treated by TNF.
A, time course for 10 ng/mL daily repeated treatment. IL-8 mRNA expression relative to GAPDH as a function of time of treatment with 10 ng/mL of TNF, replaced daily (B). Cell proliferation (C) and apoptosis (D) as a function of time (closed circles, control; open squares, 10 ng/of mL TNF replaced daily; and open diamonds, 10 ng/mL of TNF and 1 μM of PK 11195, replaced daily). The results are expressed as the minimum and maximum values of triplicate of at least 3 independent experiments.

