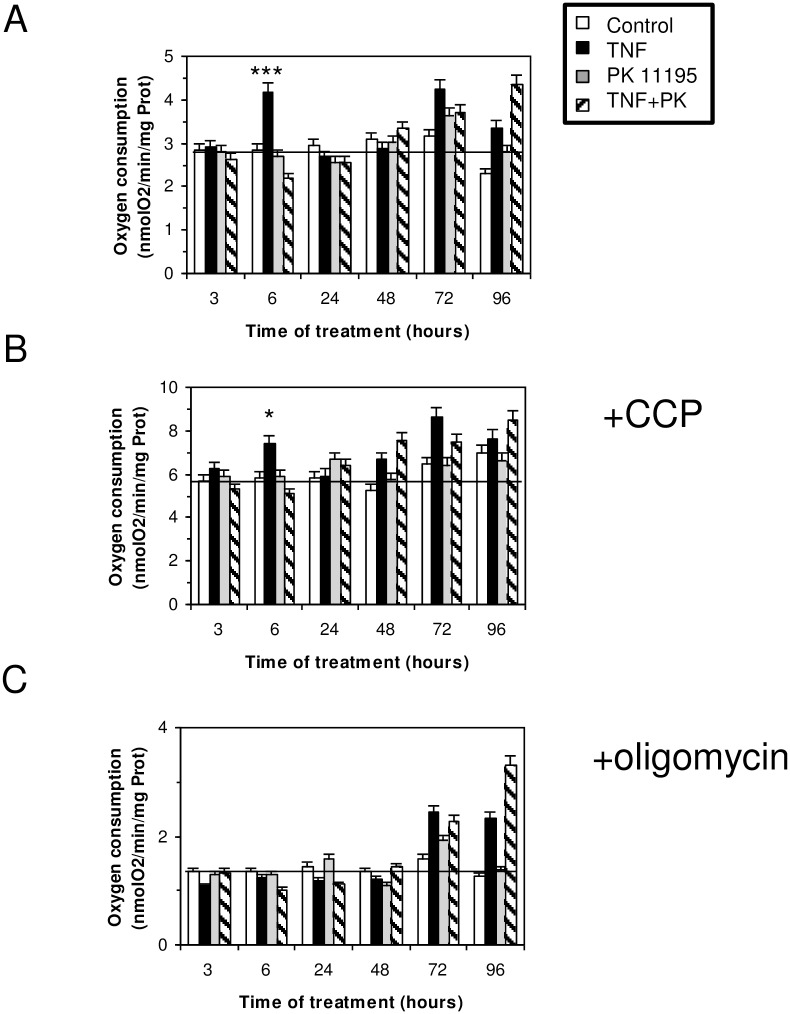
Fig 4. HT-29 cells’ oxygen consumption after different incubation times with 10 ng/mL of TNF.
(A) Oxygen consumption in control cells (open bars), in TNF-treated cells (black bars), in 1 μM of PK 11195-treated cells (grey bars), and in cells treated simultaneously with 10 ng/mL of TNF and 1 μM of PK 11195 (dashed bars). (B) Oxygen consumption in the presence of 1 μM of m-Cl-CCP, a respiratory chain uncoupler. (C) Oxygen consumption in the presence of 10 μM of oligomycin, an ATP synthase inhibitor.

