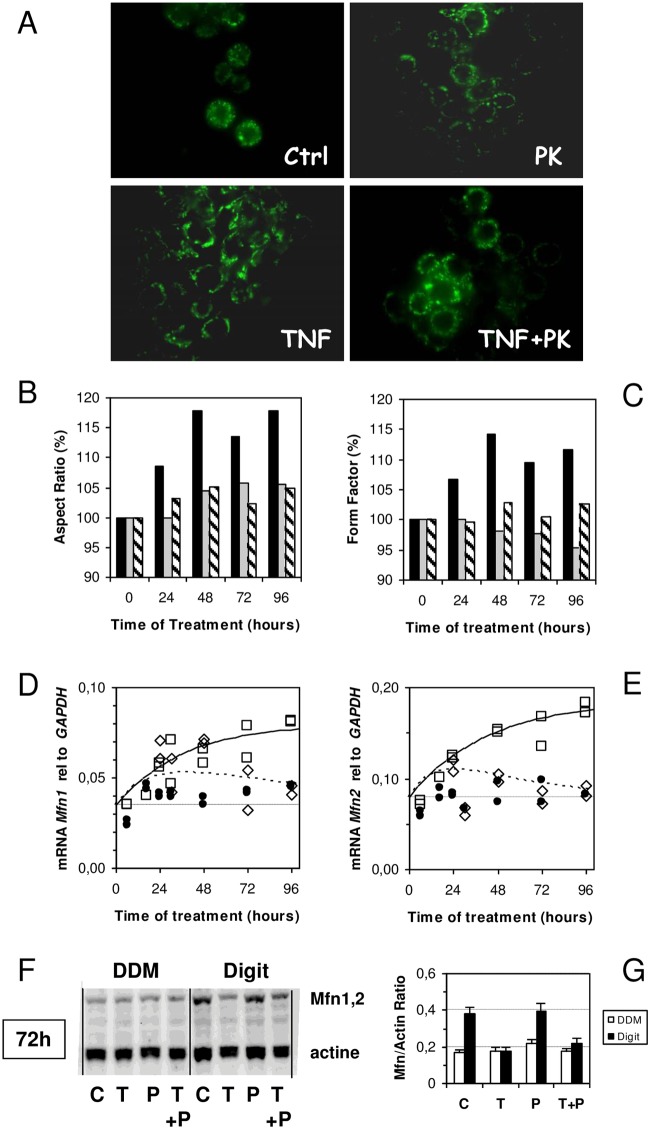
Fig 6. HT-29 cells’ mitochondrial networks and fusion proteins upon TNF treatment.
(A), Representative images of HT-29 cells expressing green fluorescent protein (GFP) targeted to mitochondria in control and treated cells. (B and C) Quantitative analysis of mitochondrial structure using morphological parameters (Aspect Ratio and Form Factor) following Koopman et al. treatment. [23] At least 500–600 mitochondria were analyzed per condition and normalized to control conditions. The time course of the Aspect Ratio (B) and Form Factor (C) changes in TNF-treated cells (black bars), 1 μM of PK 11195-treated cells (grey bars), and cells treated simultaneously with 10 ng/mL of TNF and 1 μM of PK 11195 (dashed bars). mRNA expression of mitofusins (Mfn1 and Mfn2 in panels D and E, respectively) relative to GAPDH as a function of time of treatment with 10 ng/mL of TNF (open square), the simultaneous presence of TNF and PK 11195 (open diamonds), and controls without treatment (closed circle). (F) Western blot analysis of mitofusins (1 and 2) in DDM and Digit-solubilized mitochondrial membranes after 72 hours of treatment with TNF [T], PK 11195 [P], both TNF and PK 11195 [T+P], and controls [C]. (G) Densitometry evaluation of western blot of mitofusins. The results are expressed as the means ± standard error of the mean.

