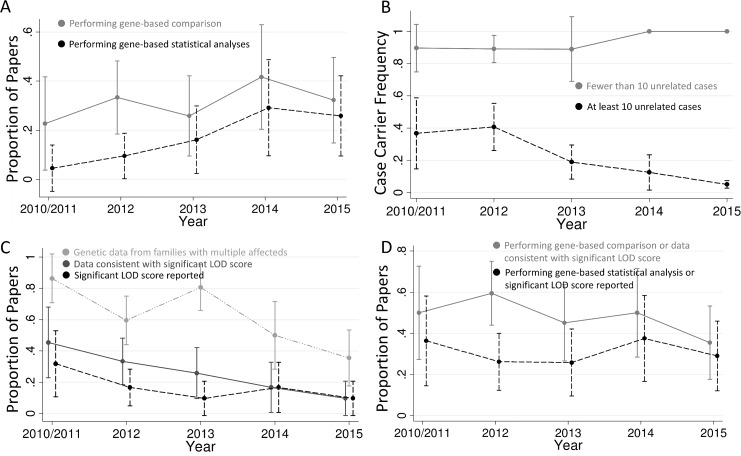
Fig 2. Trends in exome sequencing disease gene discovery papers.
(A) Proportion of studies performing gene-based comparisons and statistical analyses. There has been a trend for more papers to use gene-based comparisons versus controls with time (p = 0.44, or 0.18 if restricting to studies with at least ten unrelated cases) and a statistically significant increase in the proportion of papers using gene-based statistical analyses (p = 0.008, or 0.001 if restricting to studies with at least ten unrelated cases). (B) Proportion of cases with qualifying variants in each implicated gene. Studies with fewer than ten unrelated cases have continued to have a very high proportion of cases with qualifying variants in the implicated gene, while studies with more cases have had a progressively lower proportion of cases with qualifying variants over time (p = 0.009 for change over time). (C) Proportion of studies that include co-segregation data from families with multiple affected individuals, that present co-segregation data that appears consistent with a significant LOD score (>3.3), and that report a significant LOD score. The proportion of studies in all three of these categories has been decreasing with time (p = 0.001, 0.002, and 0.08, respectively), and the proportion of studies with co-segregation data that present data consistent with a significant LOD score has tended to decrease as well (p = 0.06; dropped from 53% in 2010/2011 to 27% in 2015; S5 Fig). (D) Proportion of studies that follow best-practice guidelines [1] in terms of either gene-based analysis or linkage analysis. The less stringent category includes studies that either perform gene-based comparisons or present co-segregation data consistent with significant linkage, and the more stringent category includes papers that perform a gene-based statistical analysis or report a significant LOD score. The total proportion of gene discovery papers following best-practice guidelines does not appear to be changing with time. Plotted are the means and 95% confidence intervals. 2010 and 2011 are merged due to only four studies being from 2010.

